- Press Releases
Sustainability
Social Impact
Explore how Zillow is driving real progress toward a more affordable and accessible housing market.
- Investors
- Careers
7 min read
Debugging Production with Event Logging

The Bug
A while back our team received a bug report that any developer of an application with search functionality dreads to see: the contents of our search results occasionally included items that didn't match the given criteria.
As you can imagine, this bug quickly climbed the priority ladder. For a site built upon the foundation of searching for apartments, we need to be sure the results we return fit the query parameters given.
An initial round of debugging revealed the reason for the issue, but not the cause: the data in our ElasticSearch index did not always match the data in our SQL database.
ElasticSearch is a search engine. You store data in it, just like a database, but it is schema-less and has incredibly powerful and performant search capabilities. Our infrastructure is set up so that when a record, such as an apartment, is saved to our SQL database, it automatically stores the attributes that we want to be able to search on into a corresponding apartment index in ElasticSearch.
This process is called 'indexing,' and it happens every time a record is created or updated. When a renter searches for apartments with less than $2,000 rent, this search is ran with ElasticSearch, then the returned apartment id's are used to fetch the actual records from the SQL database, which are then returned to the user to view in their browser.
Somehow these two data sources were diverging. The rent for an apartment might be $1,000 in the index and $2,000 in the database. Our first instinct was that there was a race condition at play. We had very recently migrated our apartment data from MongoDB to SQL, and something about this infrastructure change wasn't behaving correctly.
Diagnosis
Typically race conditions only manifest under very particular conditions, and those conditions tend to occur in production environments where multiple users and processes are doing things simultaneously. You can't just drop a breakpoint into your code and figure out where a race condition is.
In order to track this issue down we turned to a feature of NewRelic called custom events. Custom events allow you to log events within your code and then search for them using NewRelic's Insight's interface.
I opened up the code responsible for indexing records to ElasticSearch as they were saved, and injected this bit of Ruby:
if self.class == Apartment
…
::NewRelic::Agent.record_custom_event(
'ApartmentIndex',
event_params
)
end
For the sake readability I left out some setup code, namely the event_params variable. This variable is a hash that can contain whatever data you think you will need to debug your particular issue. Think of it as capturing the context of your code at the time that the event is hit. In our case we included the current apartment's ID, the response back from the ElasticSearch server, a snapshot of the apartment's attributes, and a current stack trace. For those curious, in Ruby, you can grab a current stack trace using caller_locations(0).
With this code in place we could now begin registering searchable event data every time an apartment record was indexed to ElasticSearch. In addition, we also added a scheduled process that would run a few times a day and look for inconsistencies between apartment records in our SQL database and records in ElasticSearch. If it found one it would fix the issue and send an alert to our alerting service, triggering an email to the dev team and creating a snapshot of the apartment's data.
The relevant part of this 'fixer' code is the alert notification:
AlertNotifier.perform(
error_class: Apartment,
error_message: 'Apartment ES index and db table out of sync.',
context: { apartment: apartment.to_hash }
)
Fortunately Rails makes it very easy to convert any ActiveRecord object to a hash using the to_hash method, making it simple to pass that data snapshot over to our alerting service.
With these two pieces of code in place, we now had the ability to triangulate and diagnose synchronization errors: when one occurred the dev team would receive an email and a snapshot of the apartment's data. We could then take the offending apartment's ID and run a query in NewRelic Insights to obtain a history of that apartment's indexing attempts, along with a snapshot of its data for each attempt:
SELECT * from ApartmentIndex where id=1021570 since 1 day ago
The Answer
Upon investigating this log for the next alert we received, it became obvious that multiple indexes for the same apartment would sometimes cluster together. The stack traces we recorded in the NewRelic events allowed us to pinpoint down to the line number exactly where in the code these indexes were happening. In addition, by recording the ElasticSearch server's response in the event_params, we saw that sometimes the version of the index, a counter that ElasticSearch increments each time an index is updated, would sometimes skip a number. This meant there were indexes happening outside the central place we had injected our logging.
We ended up discovering three issues feeding the race condition:
- Jobs queued after an apartment was saved would sometimes need to reindex the apartment, but they were reading from a slave database, meaning they would sometimes read outdated data that had not yet been replicated from the master database to the slave.
- Some of these asynchronous jobs were queued from
after_savecallbacks. In Rails these callbacks run before the database transaction has finished, meaning that if the job gets picked up and executed by a worker quick enough, it would read outdated data. - There was a "reindex on failure" job that attempted to reindex records if a connection error to the ElasticSearch server failed. These were rare, but happened a few times a day, and were the source of our "skipped versions". They indexed directly to ElasticSearch instead of going through our library. This was done to prevent an infinite loop of job creation in case the connection issues persisted for an extended period. This job was also queued from an
after_savecallback, meaning its reindex attempt could also read outdated data.
Once we had identified the issues and created user stories for them, implementing the fixes was fairly straightforward. We ensured that the jobs read from the master database, and we moved our job queuing from after_save callbacks to after_commit callbacks, which don't run until the database transaction has finished.
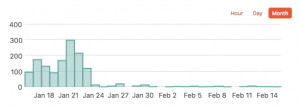
Our alerting service paints a beautiful picture of these errors as the fixes were implemented:
Conclusion
While these problems and solutions are interesting and perhaps helpful to other Ruby on Rails developers, I believe the true lesson learned is applicable to developers on any platform: lean into your logging services to diagnose difficult production problems, like race conditions. The debugger isn't always going to be helpful, and ssh-ing into a production console to manually tinker is risky, time consuming, and as a best practice probably shouldn't even be an option available to you.
If we had not used NewRelic and our alert service to track down these errors, we might still be investigating their cause.
When most of us were just getting started as developers we tended to debug our programs by littering them with print lines. Eventually we graduated to using a real debugger. In some ways these logging solutions can feel like a step back to those primal print lines - but it's not. Log streams are one of the twelve factors of a twelve factor app. They tell the history of your application. They tell a story of what it was thinking at any given moment, and best of all they are searchable.
There's no need to guess at what's happening in production when the tools you have available essentially turn it into a glass box. Whether it's NewRelic custom events, Graylog2, Splunk, ELK, or one of the myriad other logging solutions, just be sure that your application's story is being written somewhere. More importantly, be sure that you're reading it.
Related Articles


Sign up for Zillow news updates
Subscribe to receive daily emails for the latest Zillow news and announcements, product updates, research and more.
%20--%3e%3cdefs%3e%3cstyle%3e%20.st0%20{%20fill:%20%23111116;%20}%20%3c/style%3e%3c/defs%3e%3cpath%20class='st0'%20d='M.67,84.17v-9.38L39.19,20.75v-1.12H1.34V4.67h62.64v9.38l-37.85,54.04v1.12h38.97v14.96H.67Z'/%3e%3cpath%20class='st0'%20d='M75.04,9.36c0-5.58,4.13-9.71,9.94-9.71s9.94,4.13,9.94,9.71-4.13,9.71-9.94,9.71-9.94-4.02-9.94-9.71ZM76.71,84.17V27h16.53v57.17h-16.53Z'/%3e%3cpath%20class='st0'%20d='M106.3,84.17V1.32h16.53v82.85h-16.53Z'/%3e%3cpath%20class='st0'%20d='M135.33,84.17V1.32h16.53v82.85h-16.53Z'/%3e%3cpath%20class='st0'%20d='M161.79,55.58c0-18.42,12.62-30.37,31.71-30.37s31.71,11.95,31.71,30.37-12.73,30.37-31.71,30.37-31.71-11.95-31.71-30.37ZM208.58,55.58c0-9.49-6.25-16.19-15.07-16.19s-15.18,6.7-15.18,16.19,6.25,16.3,15.18,16.3,15.07-6.81,15.07-16.3Z'/%3e%3cpath%20class='st0'%20d='M246.32,84.17l-17.2-57.17h16.86l11.61,40.64h1.12l10.16-40.64h16.53l10.94,40.98h1.12l11.39-40.98h16.41l-17.31,57.17h-21.55l-8.71-37.85h-1.12l-8.6,37.85h-21.66Z'/%3e%3cpath%20class='st0'%20d='M362.44,84.17V4.67h56.94v15.86h-38.3v17.53h33.5v14.51h-33.5v31.6h-18.65Z'/%3e%3cpath%20class='st0'%20d='M428.76,84.17V27h16.3v7.82h1.23c2.46-5.36,8.04-8.93,14.07-8.93,2.34,0,4.69.56,6.48,1.45v14.85c-3.24-1.45-7.03-2.12-9.38-2.12-7.26,0-12.17,6.03-12.17,14.85v29.25h-16.53Z'/%3e%3cpath%20class='st0'%20d='M471.64,55.58c0-18.42,12.62-30.37,31.71-30.37s31.71,11.95,31.71,30.37-12.73,30.37-31.71,30.37-31.71-11.95-31.71-30.37ZM518.43,55.58c0-9.49-6.25-16.19-15.07-16.19s-15.18,6.7-15.18,16.19,6.25,16.3,15.18,16.3,15.07-6.81,15.07-16.3Z'/%3e%3cpath%20class='st0'%20d='M545.11,84.17V27h16.52v8.04h1.12c4.24-6.48,9.71-9.71,16.64-9.71,12.95,0,21.55,10.05,21.55,23.78v35.06h-16.52v-32.72c0-7.03-4.02-11.95-10.72-11.95s-12.06,5.25-12.06,12.51v32.16h-16.52Z'/%3e%3cpath%20class='st0'%20d='M617.13,65.74v-26.69h-8.04v-12.06h8.49l3.24-18.09h12.95l-.11,18.09h13.06v12.06h-13.06v26.02c0,4.8,2.9,8.04,7.59,8.04,1.56,0,4.02-.33,5.92-.78v11.84c-3.24,1.12-7.93,1.79-11.17,1.79-11.5,0-18.87-8.15-18.87-20.21Z'/%3e%3cpath%20class='st0'%20d='M686.58,84.17V4.67h34.95c19.43,0,31.93,10.27,31.82,26.69,0,16.3-12.62,26.8-31.93,26.8h-16.52v26.02h-18.31ZM704.89,44.08h15.07c9.16,0,14.85-5.02,14.85-12.73s-5.81-12.62-14.85-12.62h-15.07v25.35Z'/%3e%3cpath%20class='st0'%20d='M757.71,55.58c0-18.42,12.62-30.37,31.71-30.37s31.71,11.95,31.71,30.37-12.73,30.37-31.71,30.37-31.71-11.95-31.71-30.37ZM804.49,55.58c0-9.49-6.25-16.19-15.07-16.19s-15.19,6.7-15.19,16.19,6.25,16.3,15.19,16.3,15.07-6.81,15.07-16.3Z'/%3e%3cpath%20class='st0'%20d='M831.17,84.17V27h16.3v7.82h1.23c2.46-5.36,8.04-8.93,14.07-8.93,2.34,0,4.69.56,6.48,1.45v14.85c-3.24-1.45-7.03-2.12-9.38-2.12-7.26,0-12.17,6.03-12.17,14.85v29.25h-16.52Z'/%3e%3cpath%20class='st0'%20d='M874.16,55.58c0-18.2,12.62-30.37,31.04-30.37,15.52,0,27.36,8.71,29.25,22.22l-15.41,2.01c-1.45-6.25-7.26-10.61-13.62-10.61-8.37,0-14.74,6.92-14.74,16.75s6.25,16.75,14.63,16.75c6.59,0,12.17-4.35,13.73-10.5l15.52,1.9c-2.12,13.51-14.07,22.22-29.37,22.22-18.2,0-31.04-12.28-31.04-30.37Z'/%3e%3cpath%20class='st0'%20d='M944.73,84.17V1.32h16.52v33.39h1.12c4.35-6.25,9.71-9.49,16.64-9.49,12.95,0,21.66,10.05,21.66,23.67v35.28h-16.52v-32.83c0-7.03-4.13-11.95-10.83-11.95s-12.06,5.25-12.06,12.62v32.16h-16.52Z'/%3e%3c/svg%3e)
