- Press Releases
Sustainability
Social Impact
Explore how Zillow is driving real progress toward a more affordable and accessible housing market.
- Investors
- Careers
13 min read
Home Embeddings for Similar Home Recommendations
We introduce a deep learning-based listing embedding method using a Siamese network for similar home recommendations at Zillow. Our embedding model utilizes both collaborative and content information, models complex interactions between attributes, and effectively handles cold-start items. We have demonstrated the strong performance of our embedding method in surfacing relevant homes to the users.
Written by Sangdi Lin on October 17, 2018
by Sangdi Lin

Figure 1: Similar home recommendations on Zillow
Recommendation systems often rely on engagement from users as a source of data for learning high-quality recommendations. However, in contrast to websites such as Amazon, Netflix and Airbnb, a large number of users visiting Zillow are new users or users who do not have a registered account. These new users could be first-time home buyers, new renters, home shoppers new to online marketplaces, travelers curious about the local housing market, or people who use Zillow to obtain real estate information. For these users, the similar home carousel on each home details page (such as the one shown on the right side of Figure 1) plays an important role in surfacing interesting content and improving their experience. As users express their interest by clicking on one home, the similar home carousel enables users to directly explore related listings on Zillow, without having to return to the search page or select filters.
Deciding whether two homes are similar is not as simple as it may appear. From a content perspective, a home can be described by various structured attributes and unstructured attributes such as listing images and description. The structured attributes include home features such as location, price, size, house type, bedroom & bathroom counts and neighborhood features. How to calculate similarity from features of disparate types and scales can be a challenging problem on its own. When a user compares two homes, different structured and unstructured attributes may have different importance and interact with each other. For example, 200 extra square feet of living space can be a big difference for a condo in San Francisco, but not as important for a house in Phoenix. We would like our similar home recommendation model to “think” and compare homes from a user’s perspective.
Another way of modeling similar homes is to utilize the user-item engagement (“collaborative”) data, such as implicit user feedback (e.g., clicks and saves) as in the case of the collaborative filtering, the listing embedding method used by Airbnb , and the product embedding method developed by Yahoo . The intuition behind is that homes clicked by similar users are similar. However, it is not straightforward for these models to handle new listings, which account for a significant portion of active listings on Zillow. From mid-2012 through early 2018, the deseasonalized, smoothed monthly new listing count is near 500K . In a popular market like Seattle, a hot home can be off-market in a few days. Therefore, addressing item cold-start problems in similar home recommendations is very important for such a vibrant home-related marketplace like Zillow.
In this blog post, we introduce a home embedding model using a deep neural network for similar home recommendations. Our model leverages both collaborative and content information. More specifically, a neural network-based mapping function from the content space to the embedding space is learned, and the learning is supervised by the engagement data from users. More importantly, our model is able to handle the item cold-start problem effectively.
Our Method
Home Representation with Skip-Gram Embeddings
Neural network models require numerical representations as their inputs. Therefore, we need to find numerical representations for all of the categorical home attributes. Categorical features such as zip code have high cardinality, so one-hot encoding can result in high dimensionality and redundancy in the home representation and cause extra computational cost during training. To address these issues, we applied the skip-gram model to learn an efficient representation (embedding) for these categorical features.
The skip-gram model has been successfully applied to natural language for word representation learning. Its generalization to any sequential data is intuitive. Let’s take the zip code feature as an example as shown in Figure 2. Analogous to the natural language domain, we consider a unique zip code as a “word” in the “dictionary”, a user’s ordered clicks over different zip codes as a “sentence”, and the collection of zip code sequences from different users as a “corpus”. The skip-gram model is trained so that the representation of the current zip code is predictive of the zip codes that the same user clicked nearby in the session, i.e., within the “context window” shown in Figure 2.
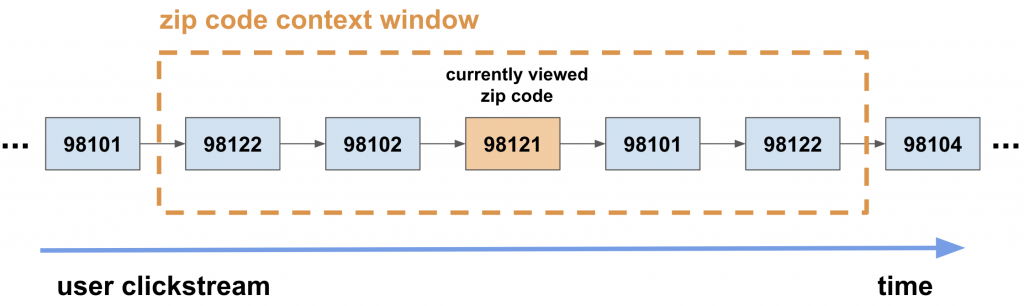
Figure 2: Illustration of applying the skip-gram model to zip code sequences
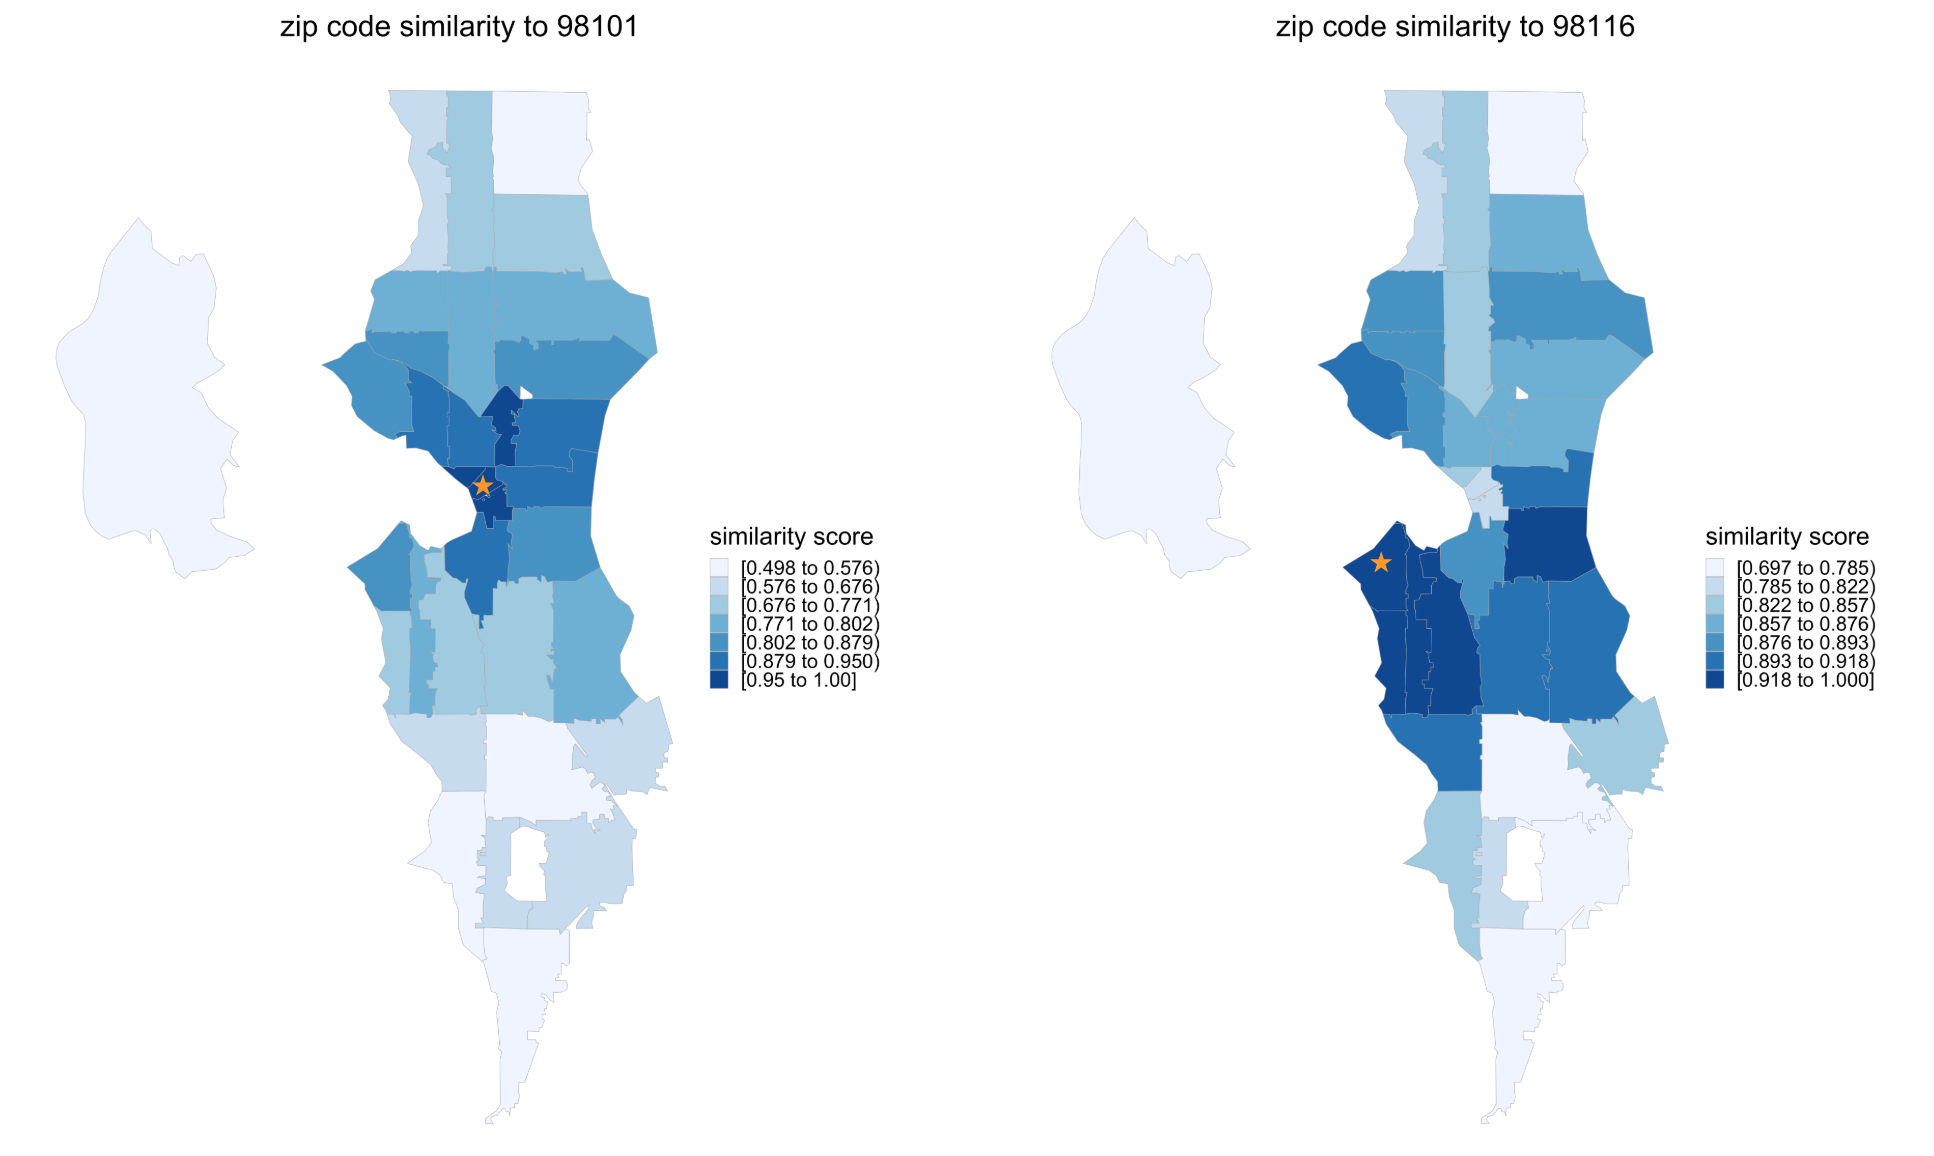
The skip-gram representation is sensible, because the distance measure on this lower dimensional representation reflects the proximity between different categorical values. This fact is illustrated by the heatmaps in Figure 3, which depict the cosine similarity between the embedding vectors of several zip code regions in the Seattle area to zip codes 98101 (on the left) and 98116 (on the right), respectively.

Figure 3: Similarity between Seattle zip codes and 98101 (downtown area, starred on the left) and between Seattle zip codes and 98116 (west Seattle area, starred on the right) based on skip-gram embeddings.
In a similar manner, we learn vector representations for other categorical features including zoning type, city region, house type, and others. Figure 4 shows the t-SNE 2-D visualizations for the learned representations of zip codes and zoning type, respectively. t-SNE is a visualization technique for high-dimensional data that maps similar data points to locations close together in a 2D or 3D space. For example, zip codes 988** and 989** are all mapped to the upper-left corner of the left plot in Figure 4 due to high cosine similarity. Once trained, these representations can be stored in a look-up table for quick reference in the future.
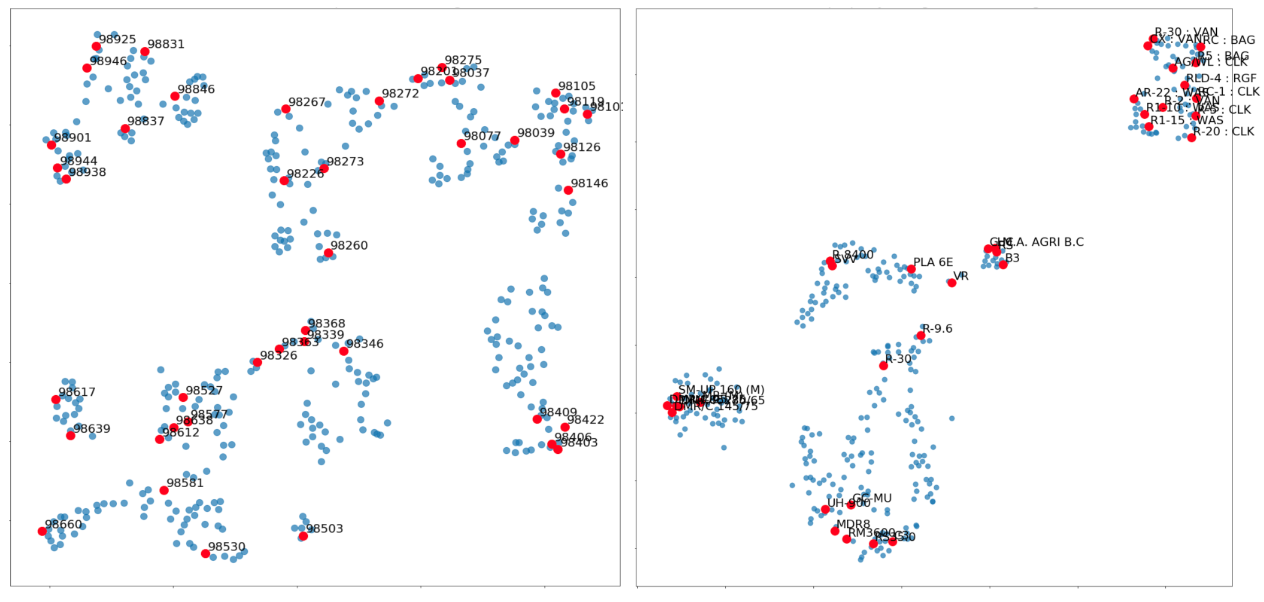
Figure 4: t-SNE visualizations in 2D space for zip codes (left) and zoning types (right) in Washington state.
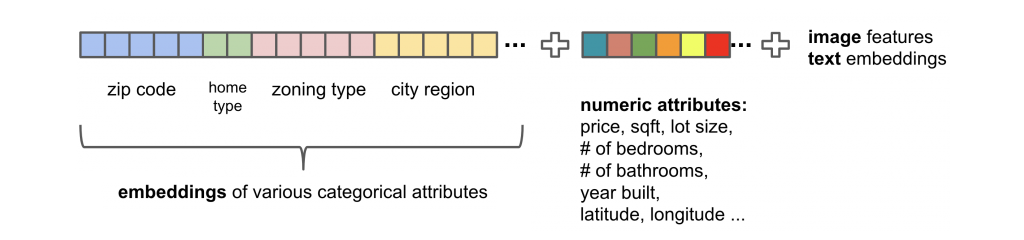
Figure 5: Home representation in the content vector space
The learned representations for the categorical features are concatenated with the numerical features to form the final content vector representation for each home as shown in Figure 5. This representation is used as the input of the deep neural network model. For numerical attributes such as price and size that have skewed distributions, some preprocessing steps, including log transformation and min-max scaling (Figure 6), can improve the performance of the neural network model. Moreover, in the future, we can incorporate features extracted from unstructured content, such as listing images and listing description, as indicated in Figure 5.
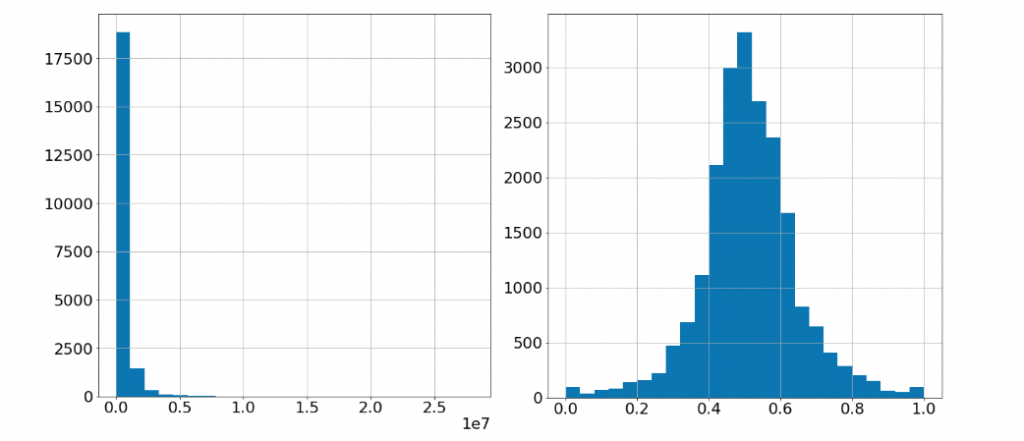
Figure 6: Example of preprocessing the numerical features. On the left: price histogram before preprocessing. On the right: price histogram after quantile clipping, log transformation and min-max scaling
Siamese Network
We use a Siamese network architecture to learn a mapping function from the content vector space (Figure 5) to the embedding vector space where the cosine similarity can be directly calculated.
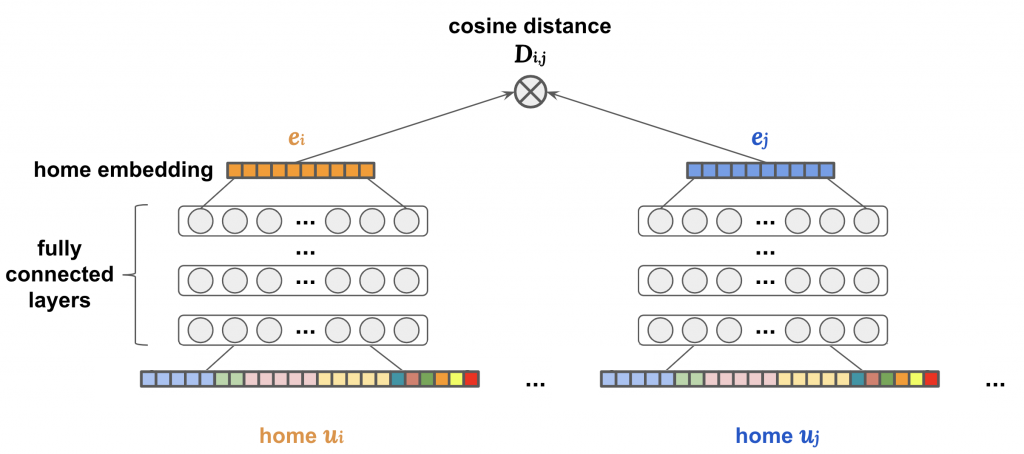
Figure 7: Architecture of Siamese network
To construct a Siamese network, the feature representations of a pair of homes, indicated by ui and uj, are passed through identical sub-networks consisting of several fully connected layers. Each sub-network maps its home into a low-dimensional embedding space ( e.g., N=25 ), as described in Figure 7.
![]()
In the new output embedding space, we want the dissimilarity between two homes to be measured by their cosine distance:
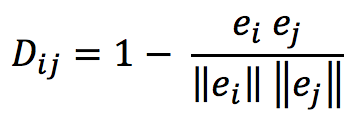
The parameters of the neural network are optimized so that in this new embedding space, similar homes have smaller cosine distances, and dissimilar homes have larger distances. The supervision for training such networks comes from the co-click or “collaborative” information contained in users’ clickstream data. To construct the training data, we assume that pairs of homes co-clicked by the same user in nearby sessions (<= 10 minutes) within certain context window (e.g., window size = 3) are relatively more similar and labeled as positives, while homes never co-clicked in this way by any user are less similar and labeled as negatives (as illustrated in Figure 8).
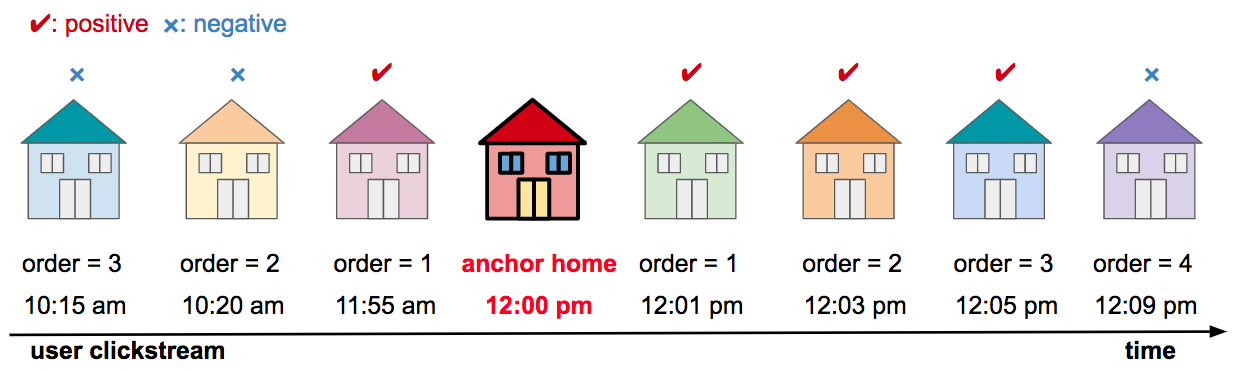
Figure 8: Illustration of extracting positive and negative homes to an anchor home from a user's clickstream data (context window size = 3, nearby session constraint: <= 10 minutes)
Loss Functions
The following two loss functions are often considered when training a Siamese network.
Contrastive loss directly optimizes the absolute value of the cosine distance between a pair of homes, so that the cosine distance is minimized for positive pairs, but maximized for negative pairs.
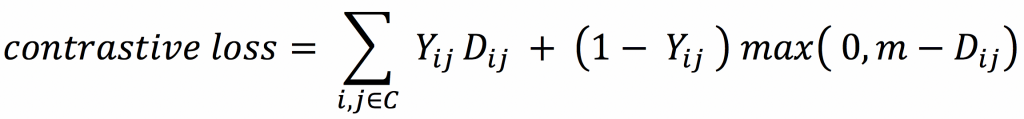
where
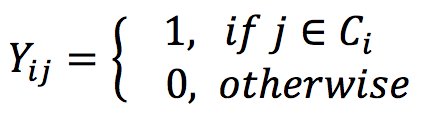
Let C represent the total set of homes. Following the above definition of positives and negatives, for each home i, Ci denotes the set of positive homes aggregated from the clickstreams of all users. Yij is the label assigned to home pair ( i, j ), positive if j ∈ Ci and negative otherwise. Dij is the cosine similarity between home i and home j in the new embedding space. A positive margin m (between 0 and 2) enables the training to focus on the challenging cases (hard negatives).
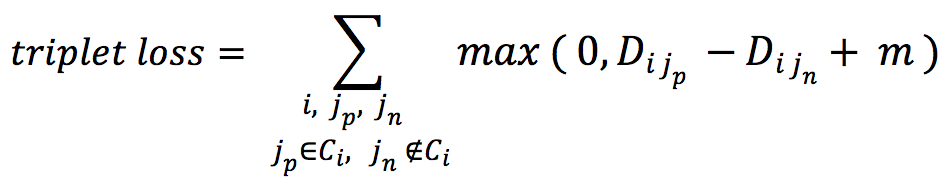
Triplet loss considers a triplet of homes ( i, jp, jn ) where jp ∈ Ci, jn ∉ Ci. Instead of optimizing for the absolute distance, the triplet loss maximizes the difference of distances between a negative pair ( i, jn ) and a positive pair ( i, jp ). The idea of optimizing over relative relevance is similar to the Bayesian Personalized Ranking (BPR) objective function which has shown effective in modeling implicit feedback. The margin m here has a similar effect as that in the contrastive loss.
When training with both loss functions, for each positive pair we observed, 5 negative pairs were sampled.
Similar Home Recommendations with Cold-Start Items
After mapping all the homes to the embedding space, similar home recommendation is reduced to a simple nearest neighbor search based on cosine distance in the embedding space. Our model can readily include any new listings in the recommendations. Whenever a new home is listed, we can look up the precomputed representations for all the categorical attributes to generate the numerical representation for the new listing. Next, the pre-trained neural network maps the numerical representation in the content space to the home embedding space where the cosine similarity can be calculated. The diagram in Figure 9 summarizes the steps to handle new listings.

Figure 9: Workflow for similar home recommendations with new listings
Evaluation
Similar home recommendation algorithms power the similar home carousel on each Zillow home details page. An effective similar home recommender should drive the user engagement by providing useful guidance for exploring the housing market. Considering a home viewed by a user in an early session, we would like the recommender to rank those homes that the user likes to explore in the later sessions more prominently in the set of recommended similar homes. Therefore, we designed a click-based relevance metric for the offline evaluation. On the testing date, by focusing on their first viewed home, we examine how the future clicks of each user are ranked in the list of recommended similar homes. The average NDCG at different ranking positions provides an offline evaluation metric for comparing different methods.
We compared the proposed embedding method to 3 other methods we’ve developed at Zillow:
- Baseline Model: simple cosine similarity calculated directly from the home representations in the content vector space shown in Figure 5 (unsupervised).
- Linear model: measuring the distance between two homes as a weighted combination of the attribute-wise differences. The weights are learned from the co-click data (supervised).
- Random Forest: a non-linear version of method 2 trained on the same set of attribute-wise difference features (supervised).
We evaluated different models based on the user event data in WA state. All the supervised models were trained on the user events a week prior to the testing date. In the left plot in Figure 10, the NDCG metrics are represented as the ratio to the NDCG@1 of the baseline method. The right plot compares the NDCG lifts of different supervised methods over the baseline method (simple cosine similarity).
Our results show that the supervision from the user co-click data resulted in a significant lift on the NDCG metrics over the baseline method. The primary reason is that users’ click patterns provide important signals such as what attributes are important and how they interact with each other. Among all the supervised methods, the proposed Siamese embedding method outperforms both the linear model and the RF model. In addition, triplet loss shows a slight advantage over contrastive loss in training the Siamese network for our application. The best model, the Siamese embedding model trained with triplet loss, achieved a significant 21% lift on NDCG@10 over the baseline method.
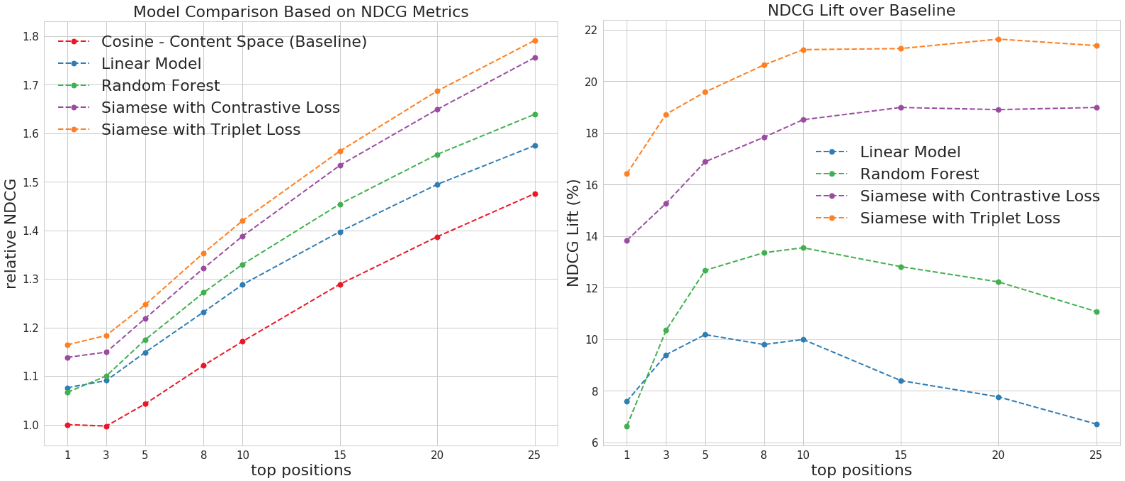
Figure 10: Comparison of different similar home recommendation methods on NDCG metrics (left) and NDCG lift over the baseline method (right).
Are the Embeddings Meaningful?
To answer this question, we visualize the 25-dimensional embeddings for the homes in Washington state in a 2D space with t-SNE. In each of the t-SNE plots in Figure 11, each dot represents a home, and the closeness between each pair of dots reflects the cosine similarity between two homes in the home embedding space. We colored the dots by the (log) scale of one of the key home features in each plot. The greater the structure in the colored clusters, the greater the importance of the specific feature in the embedding space. The idea here is quite similar to our previous blog post where Self Organizing Maps were used to visualize the collaborative filtering factors. In Figure 11, the attributes are shown in order of importance, based on the signal in the structure. From the embedding visualizations, we observe that location (longitude and latitude) appears to be the most important factor in the embeddings, followed by home price and home size. However, we should note that some features can also be important due to complex interactions with others, which may not be directly observed via the visualizations below.
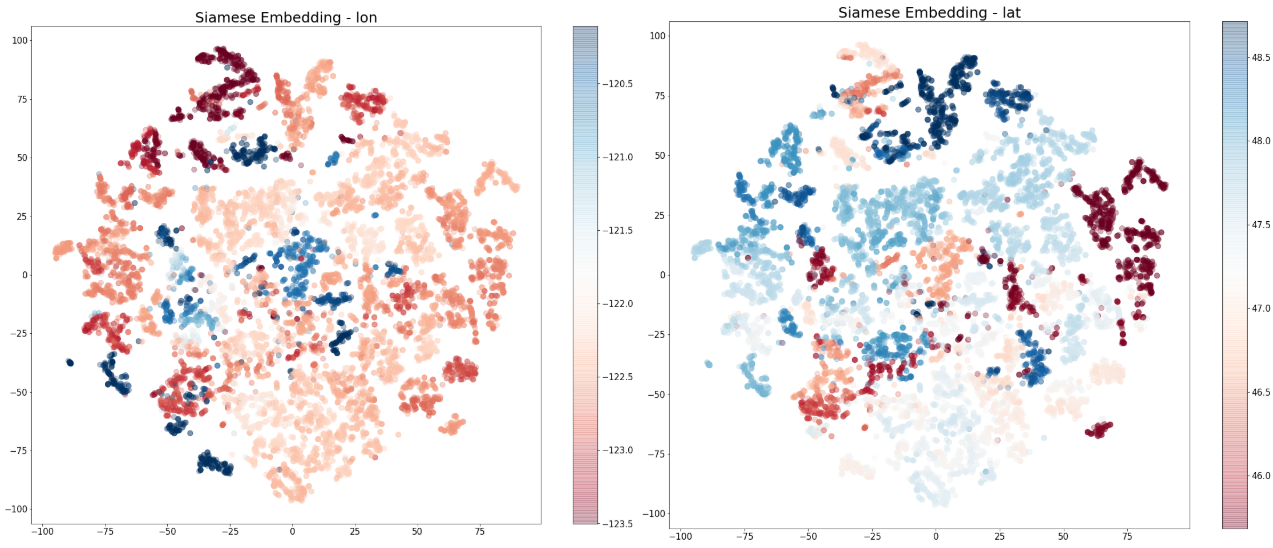
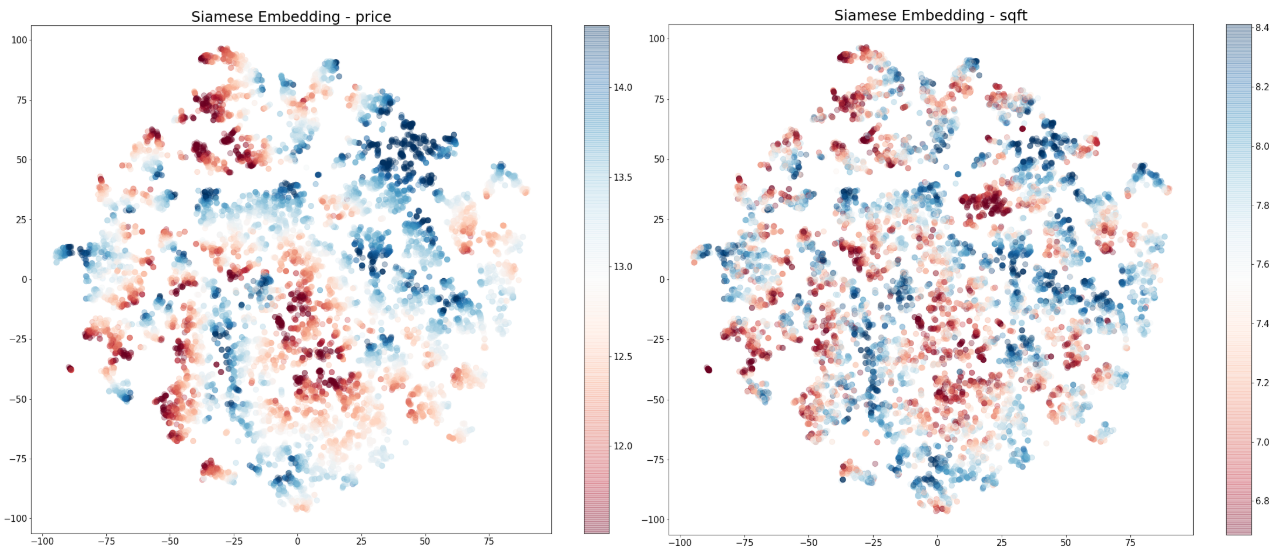
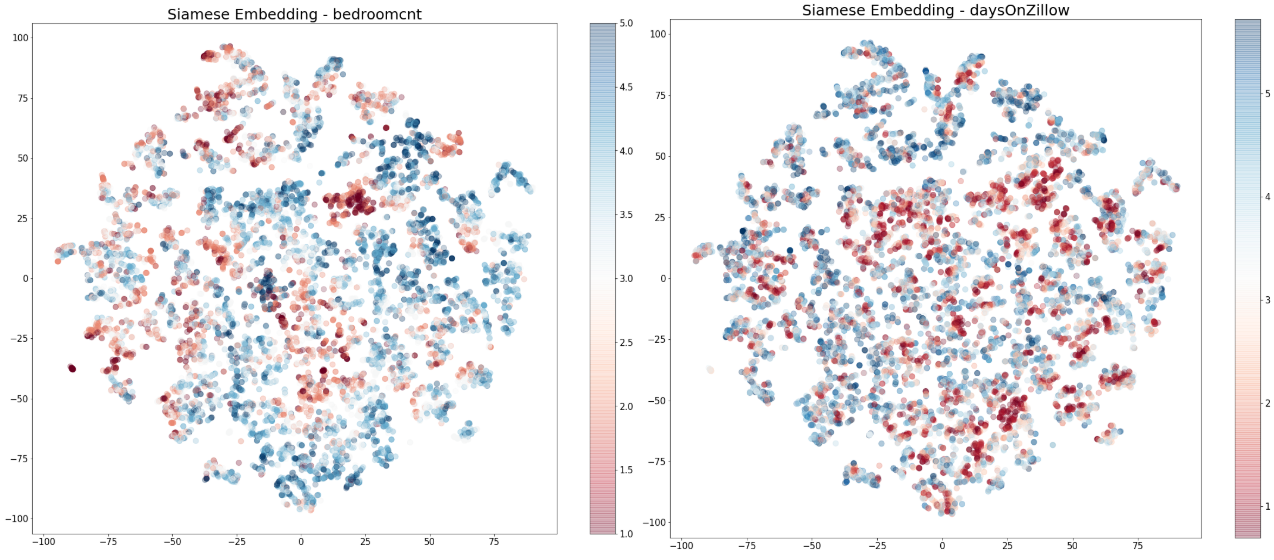 Figure 11: t-SNE 2D visualizations for the listing embeddings in Washington state, colored by the scales of some selected home attributes. Note that price, size (sqft), and days on Zillow are on the natural log scale.
Conclusion
In this blog post, we introduce a deep learning-based listing embedding method using a Siamese network for similar home recommendations at Zillow. Our embedding model utilizes both collaborative and content information, models complex interactions between attributes, and effectively handles cold-start items. The offline evaluation has demonstrated the strong performance of our embedding method in surfacing relevant homes to the users through similar home recommendations. Based on the offline results, we are currently working on using the Siamese network model to power the next generation of similar home recommendation engine at Zillow.
Many thanks to the entire personalization team at Zillow for the support to this project. Special thanks to Eric Ringger, Ondrej Linda and Egor Klevak for suggestions and feedback to this blog post.
If you find this work interesting and if you would like to apply your data science and machine learning skills to our large-scale, rich and continuously evolving real-estate data set, please reach out. We are hiring!
Reference
Grbovic, Mihajlo, et al. 'Listing Embeddings in Search Ranking.' March 13, 2018, Airbnb Engineering & Data Science @Medium.
Grbovic, Mihajlo, et al. 'E-commerce in your inbox: Product recommendations at scale.' Proceedings of the 21th ACM SIGKDD International Conference on Knowledge Discovery and Data Mining. ACM, 2015.
Gudell, Svenja. 'Inventory Is Down, But Listings Aren't (June 2017 Market Report)' Zillow Research, publication date: July 20, 2017.
Ringger, Eric, et al. 'Finding Your Home: Large-Scale Recommendation in a Vibrant Marketplace.' ComplexRec 2018.
Mikolov, Tomas, et al. 'Distributed representations of words and phrases and their compositionality.' Advances in Neural Information Processing Systems. 2013.
Maaten, Laurens van der, and Geoffrey Hinton. 'Visualizing data using t-SNE.' Journal of Machine Learning Research, Nov., 2008: 2579-2605.
Rendle, Steffen, et al. 'BPR: Bayesian personalized ranking from implicit feedback.' Proceedings of the 25th Conference on Uncertainty in Artificial Intelligence. AUAI Press, 2009.
Related Articles


Sign up for Zillow news updates
Subscribe to receive daily emails for the latest Zillow news and announcements, product updates and more.
%20--%3e%3cdefs%3e%3cstyle%3e%20.st0%20{%20fill:%20%23111116;%20}%20%3c/style%3e%3c/defs%3e%3cpath%20class='st0'%20d='M.67,84.17v-9.38L39.19,20.75v-1.12H1.34V4.67h62.64v9.38l-37.85,54.04v1.12h38.97v14.96H.67Z'/%3e%3cpath%20class='st0'%20d='M75.04,9.36c0-5.58,4.13-9.71,9.94-9.71s9.94,4.13,9.94,9.71-4.13,9.71-9.94,9.71-9.94-4.02-9.94-9.71ZM76.71,84.17V27h16.53v57.17h-16.53Z'/%3e%3cpath%20class='st0'%20d='M106.3,84.17V1.32h16.53v82.85h-16.53Z'/%3e%3cpath%20class='st0'%20d='M135.33,84.17V1.32h16.53v82.85h-16.53Z'/%3e%3cpath%20class='st0'%20d='M161.79,55.58c0-18.42,12.62-30.37,31.71-30.37s31.71,11.95,31.71,30.37-12.73,30.37-31.71,30.37-31.71-11.95-31.71-30.37ZM208.58,55.58c0-9.49-6.25-16.19-15.07-16.19s-15.18,6.7-15.18,16.19,6.25,16.3,15.18,16.3,15.07-6.81,15.07-16.3Z'/%3e%3cpath%20class='st0'%20d='M246.32,84.17l-17.2-57.17h16.86l11.61,40.64h1.12l10.16-40.64h16.53l10.94,40.98h1.12l11.39-40.98h16.41l-17.31,57.17h-21.55l-8.71-37.85h-1.12l-8.6,37.85h-21.66Z'/%3e%3cpath%20class='st0'%20d='M362.44,84.17V4.67h56.94v15.86h-38.3v17.53h33.5v14.51h-33.5v31.6h-18.65Z'/%3e%3cpath%20class='st0'%20d='M428.76,84.17V27h16.3v7.82h1.23c2.46-5.36,8.04-8.93,14.07-8.93,2.34,0,4.69.56,6.48,1.45v14.85c-3.24-1.45-7.03-2.12-9.38-2.12-7.26,0-12.17,6.03-12.17,14.85v29.25h-16.53Z'/%3e%3cpath%20class='st0'%20d='M471.64,55.58c0-18.42,12.62-30.37,31.71-30.37s31.71,11.95,31.71,30.37-12.73,30.37-31.71,30.37-31.71-11.95-31.71-30.37ZM518.43,55.58c0-9.49-6.25-16.19-15.07-16.19s-15.18,6.7-15.18,16.19,6.25,16.3,15.18,16.3,15.07-6.81,15.07-16.3Z'/%3e%3cpath%20class='st0'%20d='M545.11,84.17V27h16.52v8.04h1.12c4.24-6.48,9.71-9.71,16.64-9.71,12.95,0,21.55,10.05,21.55,23.78v35.06h-16.52v-32.72c0-7.03-4.02-11.95-10.72-11.95s-12.06,5.25-12.06,12.51v32.16h-16.52Z'/%3e%3cpath%20class='st0'%20d='M617.13,65.74v-26.69h-8.04v-12.06h8.49l3.24-18.09h12.95l-.11,18.09h13.06v12.06h-13.06v26.02c0,4.8,2.9,8.04,7.59,8.04,1.56,0,4.02-.33,5.92-.78v11.84c-3.24,1.12-7.93,1.79-11.17,1.79-11.5,0-18.87-8.15-18.87-20.21Z'/%3e%3cpath%20class='st0'%20d='M686.58,84.17V4.67h34.95c19.43,0,31.93,10.27,31.82,26.69,0,16.3-12.62,26.8-31.93,26.8h-16.52v26.02h-18.31ZM704.89,44.08h15.07c9.16,0,14.85-5.02,14.85-12.73s-5.81-12.62-14.85-12.62h-15.07v25.35Z'/%3e%3cpath%20class='st0'%20d='M757.71,55.58c0-18.42,12.62-30.37,31.71-30.37s31.71,11.95,31.71,30.37-12.73,30.37-31.71,30.37-31.71-11.95-31.71-30.37ZM804.49,55.58c0-9.49-6.25-16.19-15.07-16.19s-15.19,6.7-15.19,16.19,6.25,16.3,15.19,16.3,15.07-6.81,15.07-16.3Z'/%3e%3cpath%20class='st0'%20d='M831.17,84.17V27h16.3v7.82h1.23c2.46-5.36,8.04-8.93,14.07-8.93,2.34,0,4.69.56,6.48,1.45v14.85c-3.24-1.45-7.03-2.12-9.38-2.12-7.26,0-12.17,6.03-12.17,14.85v29.25h-16.52Z'/%3e%3cpath%20class='st0'%20d='M874.16,55.58c0-18.2,12.62-30.37,31.04-30.37,15.52,0,27.36,8.71,29.25,22.22l-15.41,2.01c-1.45-6.25-7.26-10.61-13.62-10.61-8.37,0-14.74,6.92-14.74,16.75s6.25,16.75,14.63,16.75c6.59,0,12.17-4.35,13.73-10.5l15.52,1.9c-2.12,13.51-14.07,22.22-29.37,22.22-18.2,0-31.04-12.28-31.04-30.37Z'/%3e%3cpath%20class='st0'%20d='M944.73,84.17V1.32h16.52v33.39h1.12c4.35-6.25,9.71-9.49,16.64-9.49,12.95,0,21.66,10.05,21.66,23.67v35.28h-16.52v-32.83c0-7.03-4.13-11.95-10.83-11.95s-12.06,5.25-12.06,12.62v32.16h-16.52Z'/%3e%3c/svg%3e)
