Identifying High-Intent Buyers
The Zillow® website is visited monthly by tens of millions of customers. Some arrive after typing a home address into a search engine. Others might be frequent and highly engaged users with the Zillow app installed on their phone, keeping an eye on new listings in their desired location. Some are renting and dreaming about buying. Many are happy with their current home and are only interested in understanding the value of their property or that of their friends and neighbors via the Zestimate® tool. Others are on Zillow to find the right agent, tour a home, or even to secure financing via Zillow Home Loans.
The diversity of customer intentions and reasons for using Zillow’s website and apps make developing products and AI solutions to power them a very exciting challenge to solve. While our mission is to provide every customer with a satisfying experience, we are especially interested in the segment of customers with high intent to buy a home in the near term.
The complexity and fragmentation of real-estate transactions creates a need to inform, educate, guide and empower people to make an offer, obtain financing and eventually transact on their desired home. The set of product features to accomplish these goals is quite different from features for users who are just dreaming about buying in the future or checking on their home value. Being able to identify high-intent buyers enables us to personalize their experience and maximize our ability to help them with their real-estate journey.
Propensity Models
So how do we identify high-intent users among the millions using Zillow tools? There are many relevant examples of customer intent predictions out there, for example predicting Home Buyer Stage or predicting Homeowners’ Likelihood to Sell.

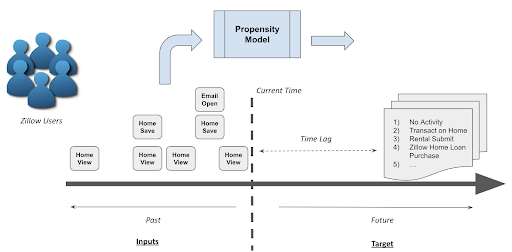
Figure 1. Predicting future propensity to act based on past activities.
The key mechanism to accomplish this for us is our likely-buyer propensity model. In general, a propensity model predicts how likely we are to observe the desired outcome from a given user. The input to such a model can be past user behavior on the site (e.g., home viewing/saving activity or opening or clicking on emails). The model target can be specifically the event we are looking to predict or its proxy in cases of delayed desired outcomes (e.g., customers closing a real-estate transaction, which can take 30-60 days). There are also several approaches to the modeling itself, one of which is training a binary classifier.
Input Features
The input features to a propensity model can be extracted from past user interaction with our products. There are three groups of features that we currently focus on: onsite activity, offsite activity and user preferences.
Onsite activity features capture the intensity of the behavior of our users when they come to our website or app and its change over time. We look at many different events across the product experiences, starting from simply visiting the site, through viewing or saving homes, to how much time on average they spend on home detail pages.
We then aggregate these user event counts over various recent time intervals, e.g. 1, 3, 7 days as well as over different platforms (e.g., web or mobile app). These time aggregates for various events create the core of our input feature vector. Intuitively, we expect the onsite engagement-based features to be increasing as a high-intent buyer approaches making an offer on a home, and decreasing afterward.

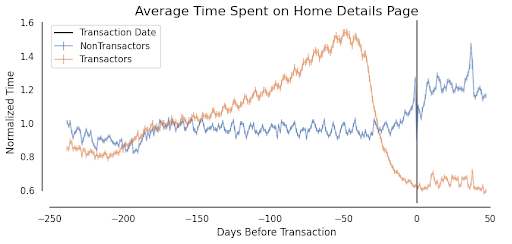
Figure 2. Increased average time spend on Home Details page prior to a transaction
Offsite activity is similar, but in this case we look at events associated with user interactions with email and push notifications. The number of messages opened and clicked on from various campaigns in time intervals over the past days and weeks are examples of some of the features we compute.
The final group of user input features are associated with implicit user profiles and their changes over time. For personalization purposes, we try to understand and predict the user’s preference toward a desired location (e.g. which cities they are interested in moving to) and home attributes (e.g.,their ideal price range or number of bedrooms).
On their own, these preferences might not be particularly predictive of user intent, but the changes of these preferences over time are informative. For example, consider a user who starts their real-estate journey by searching and comparing multiple different locations across multiple neighborhoods. As the user starts to better understand what the available supply is and what they can afford, they likely would start narrowing their search and interactions to a smaller set of ideal locations.
The way this would show up in their user preferences is that the variance towards neighborhoods would start decreasing as the customer approaches their decision to make an offer on a home. Our feature-processing pipeline captures features correlated with the variance of user preferences and their changes in the recent time intervals.

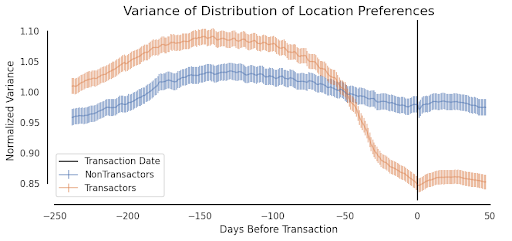
Figure 3. Increasing location focus of a buyer in anticipation of a purchase.
Bringing it all together, the above feature processing gives a vector of more than 1,500 features describing the user’s recent behavior using Zillow tools. It is important to note here that we fully embrace our customers’ right to control their own data and we allow them to opt out from having their data being used for targeting and personalization via our privacy program.
Target Labels
The ideal target labels on which to train a propensity model are the desired outcomes themselves. For example, to build a propensity model to identify users interested in submitting a rental application, we could use the exact event of users submitting a rental application through Zillow.
For our high-intent buyer model, our objective is to identify users who are likely to transact on a home in the near future. But what exactly does transacting on a home mean and what visibility do we even have into that process?
Most users are active on Zillow platforms during the process of searching and discovering, and some continue their activity further after connecting with a Zillow Premier Agent® or getting a mortgage through Zillow Home Loans. However, for most users who end up transacting on a home, their “high-intent” activity (e.g., working with an agent, making an offer and closing on the home) takes place outside of Zillow’s platforms.
Fortunately, the final outcome of the process – the closing on a home – will eventually become part of a public record within about 60 days. Therefore, our target labels are extracted from completed real-estate transactions that we are able to match to registered Zillow customers.
Model Training and Evaluation
As suggested earlier, there are multiple approaches to training a propensity model, such as survival models or predicting “time-to-act.” Our current approach is to train a binary classification model, learning the difference between customers labeled as positive examples via our transaction matching algorithm and the rest of the users.

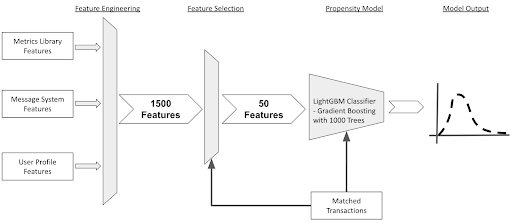
Figure 4. Overview of the model training process.
The first step in the model training process is to perform feature selection. At Zillow scale we are processing and scoring tens of millions of users daily, and with 1,500 features per user, this process can become quite costly.
In addition, many features are expected to be highly correlated. For example, most users who viewed many homes also saved or shared many homes. Therefore, the feature-selection stage helps us make the model training and scoring more efficient but also removes many features that provide very little or no incremental value for the modeling task.
The feature selection is accomplished first via univariate selection methods, then by removing lower ranked and highly correlated features, and finally by selecting the top features based on importance from a random forest model. This process results in a set of 50 features. This final narrower set of features also helps us maintain interpretability of the model, which is important for debugging and understanding as well as for validating compliance with fair housing guidelines and explaining model decisions.
As with many similar machine learning problems, the set of positive and negative labels is heavily imbalanced in favor of the negative class. Therefore, before we train our model, we downsample the negative class. This helps with the training process but means the model’s outputs are not calibrated to the natural distribution. The specific model we currently use is a variant of Gradient Boosting Decision Tree classifier consisting of more than 1,000 trees.
After the model is trained, we can interpret it using feature importance. The model learned to assign high propensity to transact on home scores when a user has:
- Higher count of ForSale home detail page views in the past 28 and 56 days.
- Longer session duration.
- Higher value of maximum dwell time on home detail pages.
- Higher count of home page visits.
- Higher count of home shares and home saves.
- Higher count of agent profile page views.
- Lower engagement with For Rent pages
Because the model is trained as a binary classifier, we can evaluate it using any of the commonly used metrics for classification models, such as Area Under the Curve (AUC). While AUC is good at allowing us to compare two models, it is difficult to interpret the AUC value on an absolute basis to determine if our model is “good enough” for production use cases.
The reason for this is that our training labels are only partially covering the true set of High-Intent Buyers. In other words, in addition to our positively labeled users based on the Transaction Matching algorithm, we expect many additional high-intent users not to be matched and thus labeled as negative examples. This results in our precision and recall as well as the AUC metric being considerably inaccurate and only relevant to our partial known ground truth.
To provide insights about model performance despite the above described difficulty with the true (and unavailable) reference, we look at the skew in the probability distribution function of known positive labels across various deciles of the model scores. We bucket all scored users based on their predicted propensity into deciles and then compute the proportion of positive labels contained in each decile.
Intuitively, for our propensity model to be of any use, one would expect to observe a significantly higher proportion of positive labels to be allocated to higher deciles. This is indeed what we can observe with the trained model, which shows that users in the top 10th decile are 52x more likely labeled as positive than decile 1, 10x more likely than decile 5 and 3x more likely than decile 9.

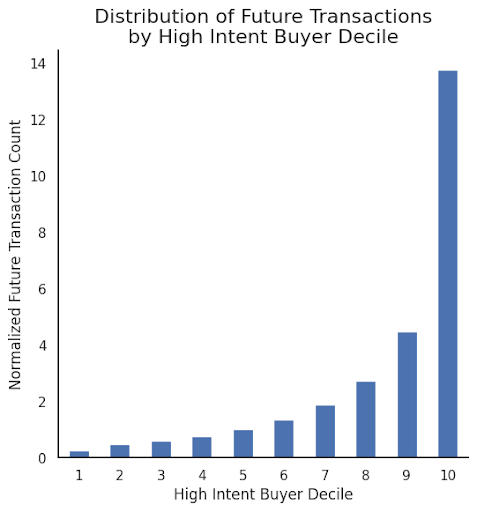
Figure 6. Distribution of future home transaction for users in different high-intent buyer deciles.
Applications of Propensity Models
The high-intent buyer propensity model described above is a model that is applied in a batch job to score all Zillow registered users who have been recently active on our website or app. The model scores are then served either as daily snapshots or via an API to enable high-intent, customer-focused experiences across marketing and product features. For example, with the propensity model above, we can personalize which customers should be seeing local agent upsell messaging versus which users should see more home recommendations.


Figure 7. Propensity-dependent customer experience upselling the connection with a local agent.
Our plans are to move to more near-real-time customer intent classification and segmentation, which would enable us to serve our customers even better by responding to their needs in real time as their preferences evolve. This will enables us to strive to build customer experiences where we do not have to choose between either optimizing for engagement and retention of our “dreamers” or business outcomes of our “serious buyers” but rather provide each user with the right experience and tools based on their particular intent and stage of their real estate journey.