- Press Releases
Sustainability
Social Impact
Explore how Zillow is driving real progress toward a more affordable and accessible housing market.
- Investors
- Careers
18 min read
Incorporating Listing Descriptions into the Zestimate
Zillow 2022 AI Forum

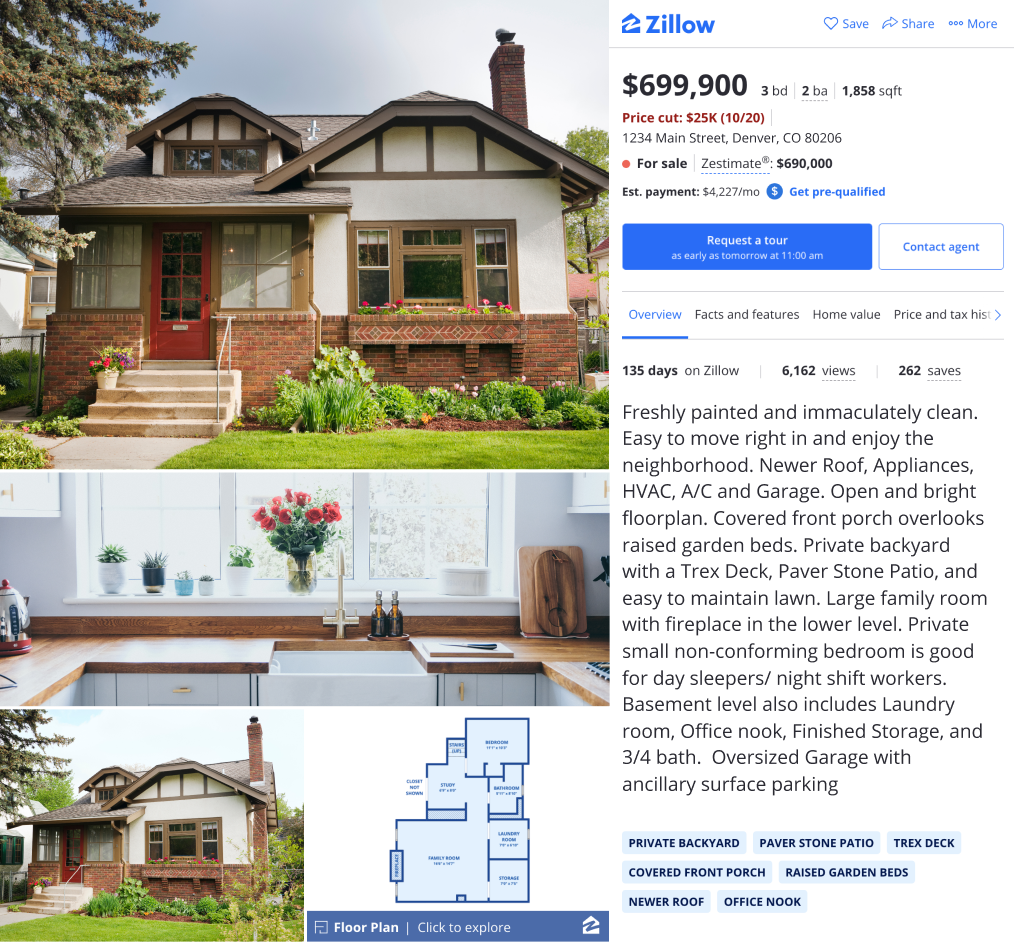
Figure 1: A Zillow Home Details Page (HDP) with a detailed listing description and blue Home Insight tags below.
“Freshly painted and immaculately clean. Easy to move right in and enjoy the neighborhood. Newer Roof, Appliances, HVAC, A/C and Garage. Open and bright floorplan. Covered front porch overlooks raised garden beds. Private backyard with a Trex Deck, Paver Stone Patio, and easy to maintain lawn. Large family room with fireplace in the lower level. Private small non-conforming bedroom is good for day sleepers/ night shift workers. Basement level also includes Laundry room, Office nook, Finished Storage, and 3/4 bath. Oversized Garage with ancillary surface parking (Figure 1). ”
Now that’s a descriptive listing! Imagine being able to feed all of that information into an automated valuation model (AVM) like the Zestimate® model.
Some standard facts in listings, such as the number of bedrooms, bathrooms or square footage, are readily available in structured public or MLS data, which the Zestimate model currently ingests. Other information often contained in a description such as “private backyard,” “paver stone patio,” and “newer roof,” are likely informative of home value and typically harder to obtain.
Of course, using listing descriptions comes with its own challenges. Surrounding those phrases of interest are often other terms that are uninformative of home value (e.g., a realtor’s contact information or showing times), subjective (e.g., “amazing value,” “spacious,” or “charming“), ambiguous (e.g., the term ‘pool’ requires context to know if there is a swimming pool or a pool table), or even aspirational (e.g., “tear down this house to build the mansion of your dreams!”)
In a new effort by the Valuation team at Zillow, we have set out to determine an optimal way to include listing description information into the Zestimate valuation. There are a number of ways to tackle this. We’ll go through a couple methods while weighing pros and cons, and then describe a promising path we have chosen to pursue and how we have been testing it out in the Zestimate model.
Possible Approaches
The simplest and oldest approach for extracting text features is to use regular expressions (RegEx). While RegExes are precise and straight-forward when targeting specific phrases, they’re not ideal for our particular use case, which requires more flexibility.
Let’s say we want to flag whether a listing description says a home has hardwood flooring. We would need to craft RegEx logic for every possible phrase that indicates hardwood floors (e.g. “hardwoods,” “bamboo flooring,” “oak floors,” “cherry hardwoods,” and so on). Doing that for all the features we want to extract from listing descriptions would require identifying all possible synonyms (prior to release, which runs the risk of missing new ones) and hard coding them into our preprocessing code.
Luckily, there are more sophisticated methods coming out of the natural language processing community that better suit our application and we can save RegExs for very targeted flagging, such as identifying properties we won’t value, like an invalid home type or a vacant lot.
Methods that are state-of-the-art utilize text embeddings. Imagine if we could represent each listing description as a single vector embedding the information contained in the description. This starts with word embeddings, which are vector representations of words contained within a document and can be obtained using methods such as Word2Vec, GloVe, or BERT .
One way to form the listing description embedding would be to compute the average of the word embeddings. Alternatively, we could use Doc2Vec to create embeddings directly from entire documents (as opposed to aggregations of word embeddings), which in this case would be full listing descriptions.
Either way, similar listing description embeddings would represent similar listing descriptions. Using a visualization method such as tSNE (t-distributed stochastic neighbor embedding) or UMAP (Uniform Manifold Approximation and Projection) would reveal how these high dimensional listing description embeddings of homes that share characteristics are clustered together in lower dimensional space (Figure 2). All embeddings would be of equal length, so we could feed these directly into our AVM by making each element of the vector a new feature (column) in our training data. Of course, dimensionality reduction methods, such as principal component analysis, could be performed on our embedding vectors to concentrate the dominant signal across a smaller number of new features.
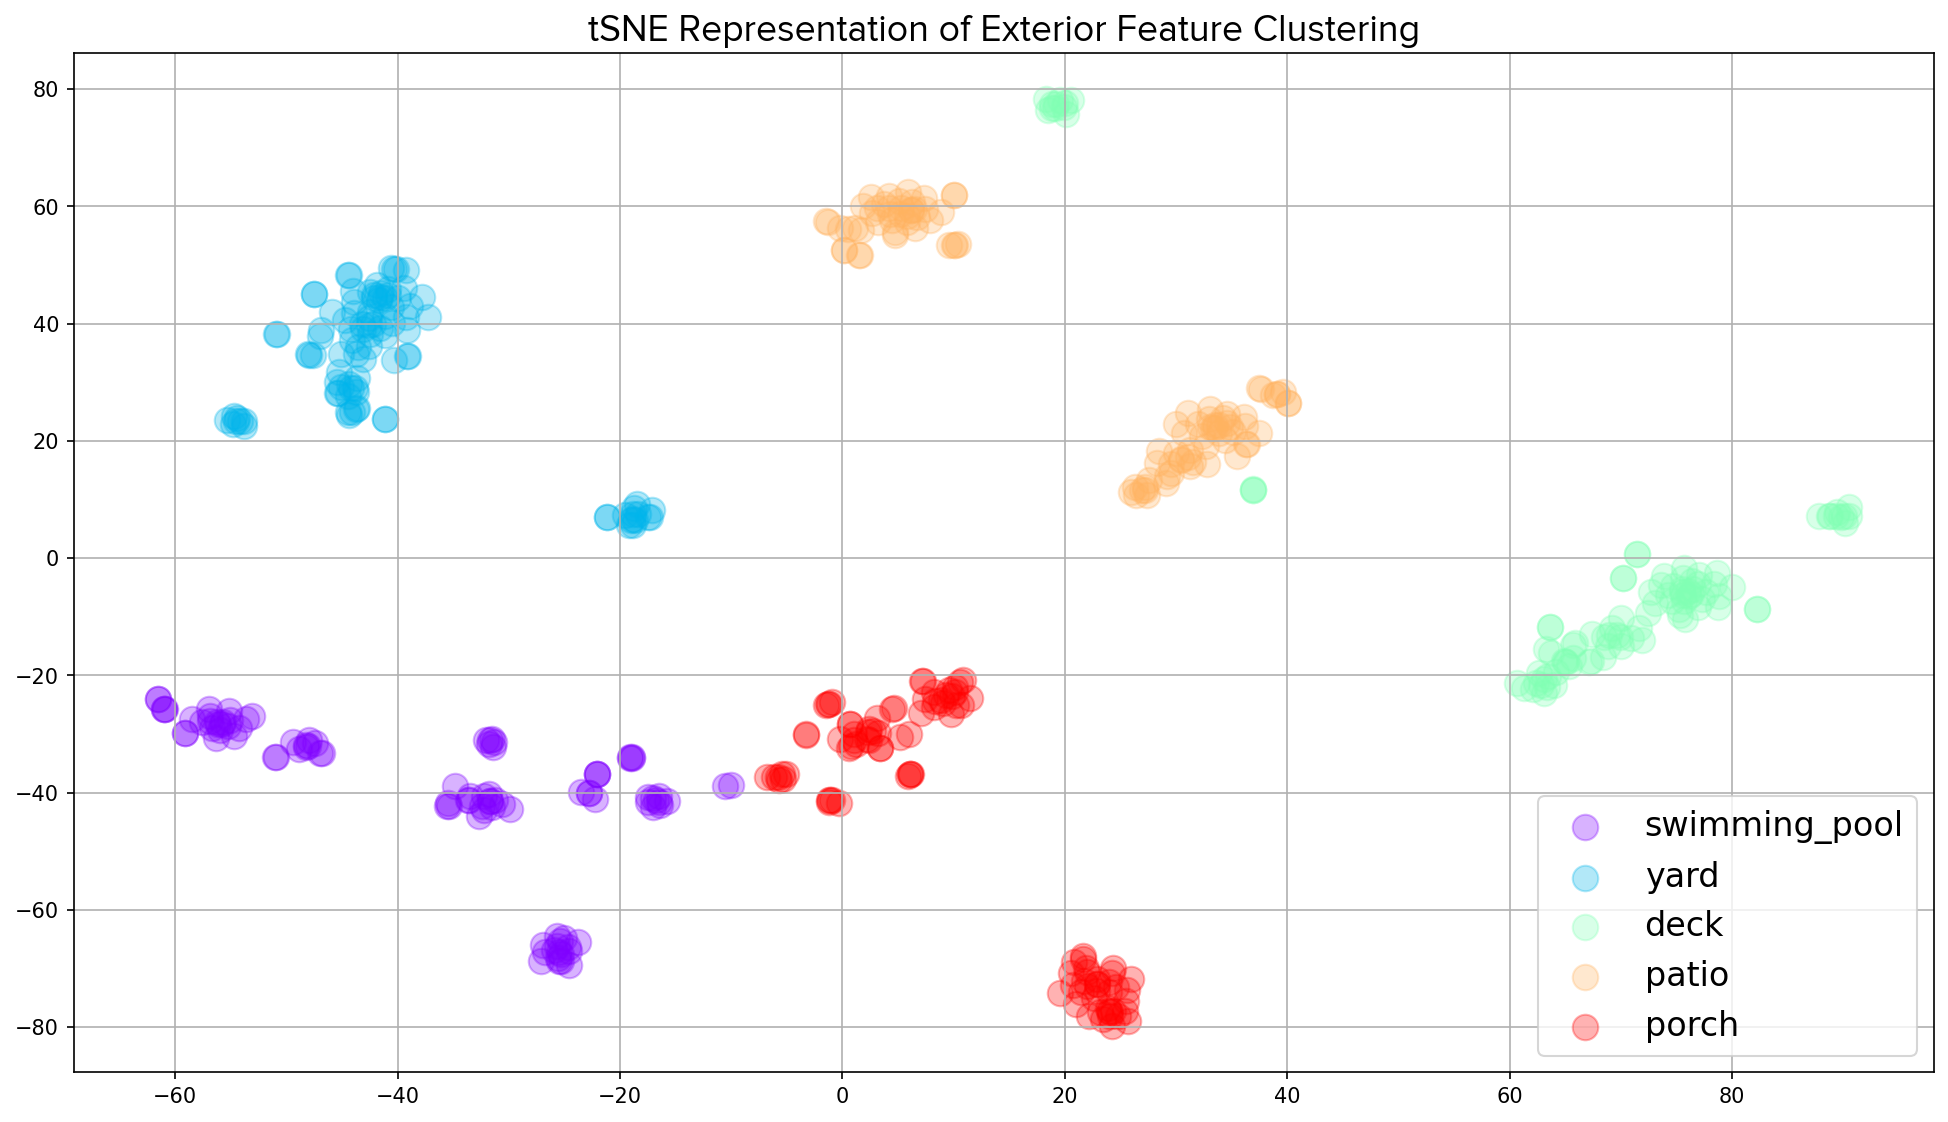
Figure 2: An example of a tSNE visualization that reveals clustering in homes whose listing descriptions mentioned various external features such as swimming pools, yards, decks, patios or porches.
Pros of this method include being able to use the entire listing description mostly as-is (minus any necessary pre-processing such as stop-word removal and tokenization) without cherry-picking certain words or categories to target. A tradeoff here, however, is a loss in explainability.
It would be great if each dimension of the embedding vector mapped to a particular amenity of the home as it would make interpretation of the impact of the new features much more straightforward. In reality, however, each dimension is more abstract in which parts of the listing description it represents and thus, we would lose some explainability in the model’s performance and predictions. In our case, we are committed to making the Zestimate valuation more explainable, not less, rendering this particular method less ideal for our application.
Ideally, we want to find actual phrases found in listing descriptions without having to target each one specifically and then group them into broader categories for our model. Lucky for us, some of our colleagues on Zillow’s Personalization team have developed a new product called Home Insights that takes us most of the way there .
The entire Home Insights pipeline extracts, filters, ranks and displays distinguishing terms from property listing descriptions (see the phrases highlighted in blue underneath the listing description on Figure 1). For our use case, the output of the first two steps of that pipeline provides us with a list of verbatim terms and phrases found in each listing description.
Our Zillow Personalization team has also worked to organize Home Insights tags into a Real Estate Taxonomy , which is essentially a hierarchy in which terms have parent-child relationships. Thus, subtrees are natural clusters of broader categories (Figure 3). Having a universe of terms representing a certain type of amenity will help us map new terms into these categories.
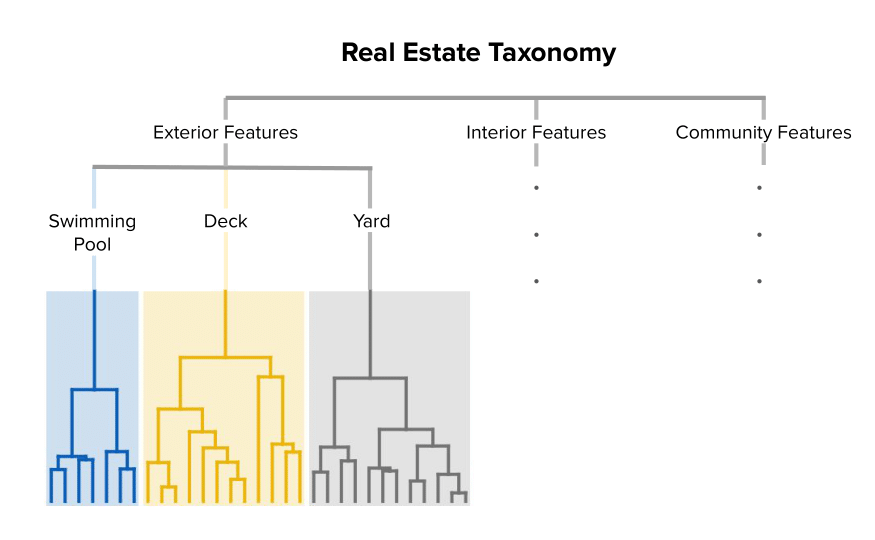
Figure 3. A diagram of a real estate taxonomy that defines hierarchical relationships of home attribute terms.
As we refer to the taxonomy, keep in mind the terms hypernym and hyponym. A hypernym is a superordinate, which is a word or phrase with a broad meaning that more specific words fall under. A hyponym is a word or phrase with a more specific meaning. In the case of the taxonomy pictured in Figure 3, “yard” is a hyponym to the hypernym “exterior features.” But “yard” is also a hypernym to more specific yard-related phrases such as “fenced-in backyard,” or “landscaped yard.”
We can identify subtrees of the taxonomy that we want to test as new features in our AVM and select all associated hyponyms within that hypernym’s subtree. In order to calculate similarities between new tags and tags already categorized, we’ll convert all of those to embedding vectors. We can do that using various representation learning models, such as fastText , fine-turned on listing description text.
Next, we can convert Home Insight tags to text embeddings using the same fastText model. Using these two sets of embeddings, we can find the subtree of the taxonomy that maps most similarly to each new Home Insight tag and flag that property as either having or not having that hypernym. Some tuning is required at this step to determine a desired similarity threshold (more on this later).
This is our optimal approach for a variety of reasons. The required similarity threshold tuning is important, and improper tuning could lead to misclassifications, but aside from that factor there are many benefits to this approach.
First, by selecting the categories of the taxonomy that we’re interested in, we can avoid subjective tags and focus on extracting new features in categories that are gaps in our current training set. Features such as whether the home has a swimming pool, finished basement, hardwood floors, or vaulted ceilings are attributes that are not always available in county or MLS data but are likely to be mentioned within a listing description.
Second, by avoiding using embedding vectors directly, we maintain explainability. This solution gives us comprehensible new features where we can be fairly certain the feature is flagged because the listing description references it in some form.
Lastly, it’s always great to avoid reinventing the wheel whenever possible. Being able to transform Home Insights tags into training data for our Valuation team’s AVMs is a worthy example of successful cross-team collaboration, opening up the opportunity for us to improve our model metrics while amplifying the impact of the Personalization team’s Home Insights model. Win, win.
Home Insight Tag Featurization
Let’s go through a more specific example — create new features indicating whether the listing description mentions the existence of a swimming pool.
Here our taxonomy contains a subtree of terms related to the broader label of swimming pool. For this example, we’ll select a small sample (“heated pool,” “in-ground pool,” “infinity pool,” “backyard pool,” “pool oasis”) for a total of six terms representing a swimming pool when including the hypernym.
Using a fastText model fine-tuned on thousands of listing descriptions, we embed them in semantic-space; if each vector is length n (where n is a parameter of the fastText model), our resulting dataframe is 6 x n. This data frame is used as the training data in a K-nearest neighbors algorithm, which is later used to query for each Home Insight tag's nearest neighbor to determine whether it belongs to the swimming pool label. Note that in practice, we would include many more terms that fall under the swimming pool hypernym as potential neighbors in the KNN algorithm and we would select other hypernyms of interest (and all of their hyponyms) as well.
Home Insights is a fairly new product, so we first needed to backfill tags onto over 65 million listing descriptions to cover the 10 years of training data that the Zestimate model requires. This resulted in over 690 million Home Insight tags with 38.5 million unique tags!
After backfilling, we convert all tags to embeddings using the same fastText model that we used to transform taxonomy terms to embeddings earlier. For each unique tag we query the KNN, pull its nearest neighbor, and flag that property as having a swimming pool only if the similarity of the two vectors (inverse of distance) is within some predetermined threshold. For tuning and testing later on, we keep versions of these features at a range of similarity thresholds.
As an example, let’s take the home from the listing description we looked at earlier (Figures 1 and 4a). And let’s suppose that in addition to the category swimming pool, we’ve included all hyponyms under deck and yard as well in our taxonomy KNN, allowing us to look for features in any of those three categories. Each Home Insight tag is converted to an embedding, which is used to find its most similar term within the taxonomy.
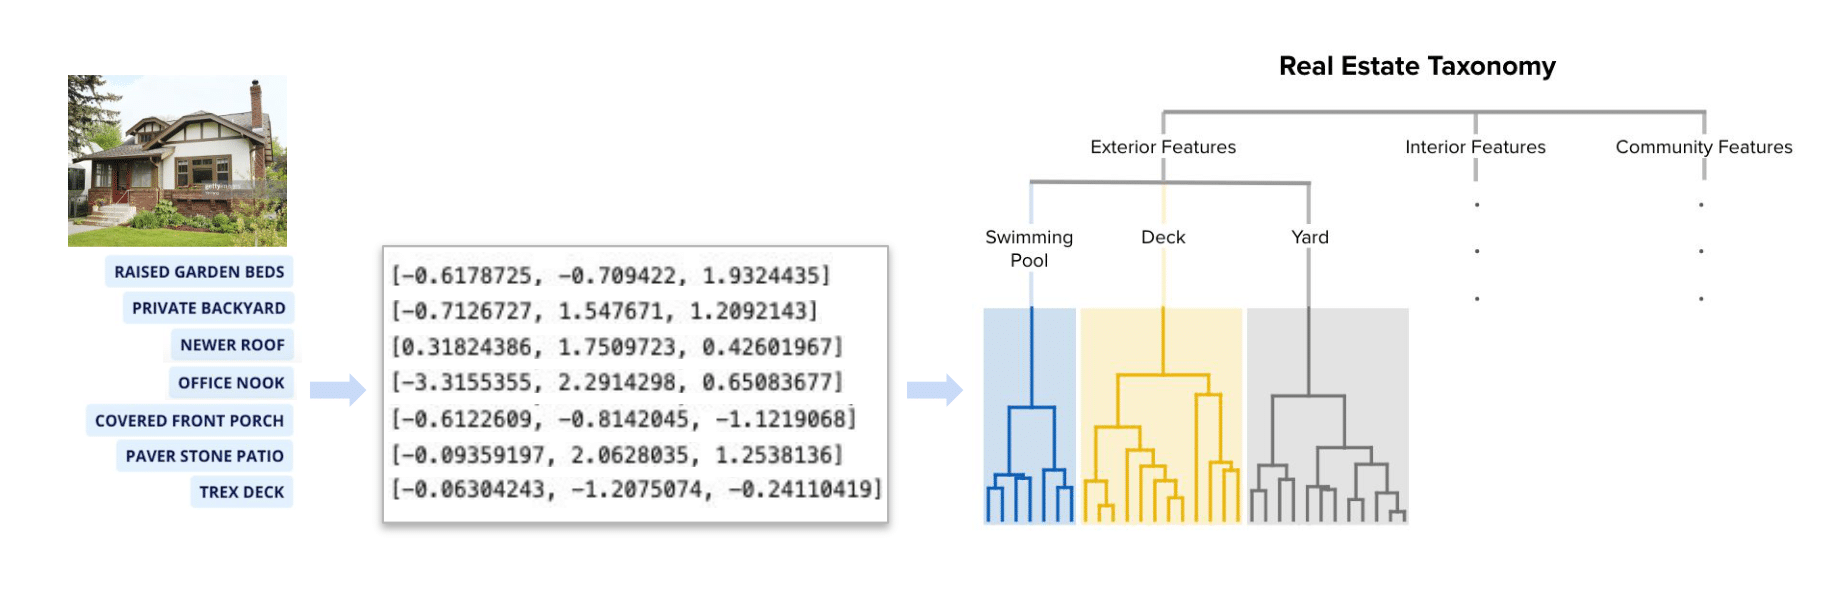 Figure 4a. A generalization of the process involved in using a listing’s Home Insight tag embeddings and our Real Estate Taxonomy. Note that in reality tag embeddings are longer than three dimensions and there are many more categories within the taxonomy.
Using a similarity threshold of 0.8, in Figure 4b we see that both ‘private backyard’ and ‘trex deck’ map to the yard and deck labels, respectively, which means that the similarity of those tags to at least one hyponym within each of those categories was greater than or equal to 0.8. If the nearest neighbor of ‘paver stone patio’ is ‘swimming pool patio’ within the ‘swimming pool’ hypernym, but the similarity of those two terms is only 0.52, we would flag this home as not having a swimming pool in our training data for the Zestimate. In this case we are correct, but this highlights the importance of tuning the similarity threshold in order to avoid potential misclassification.
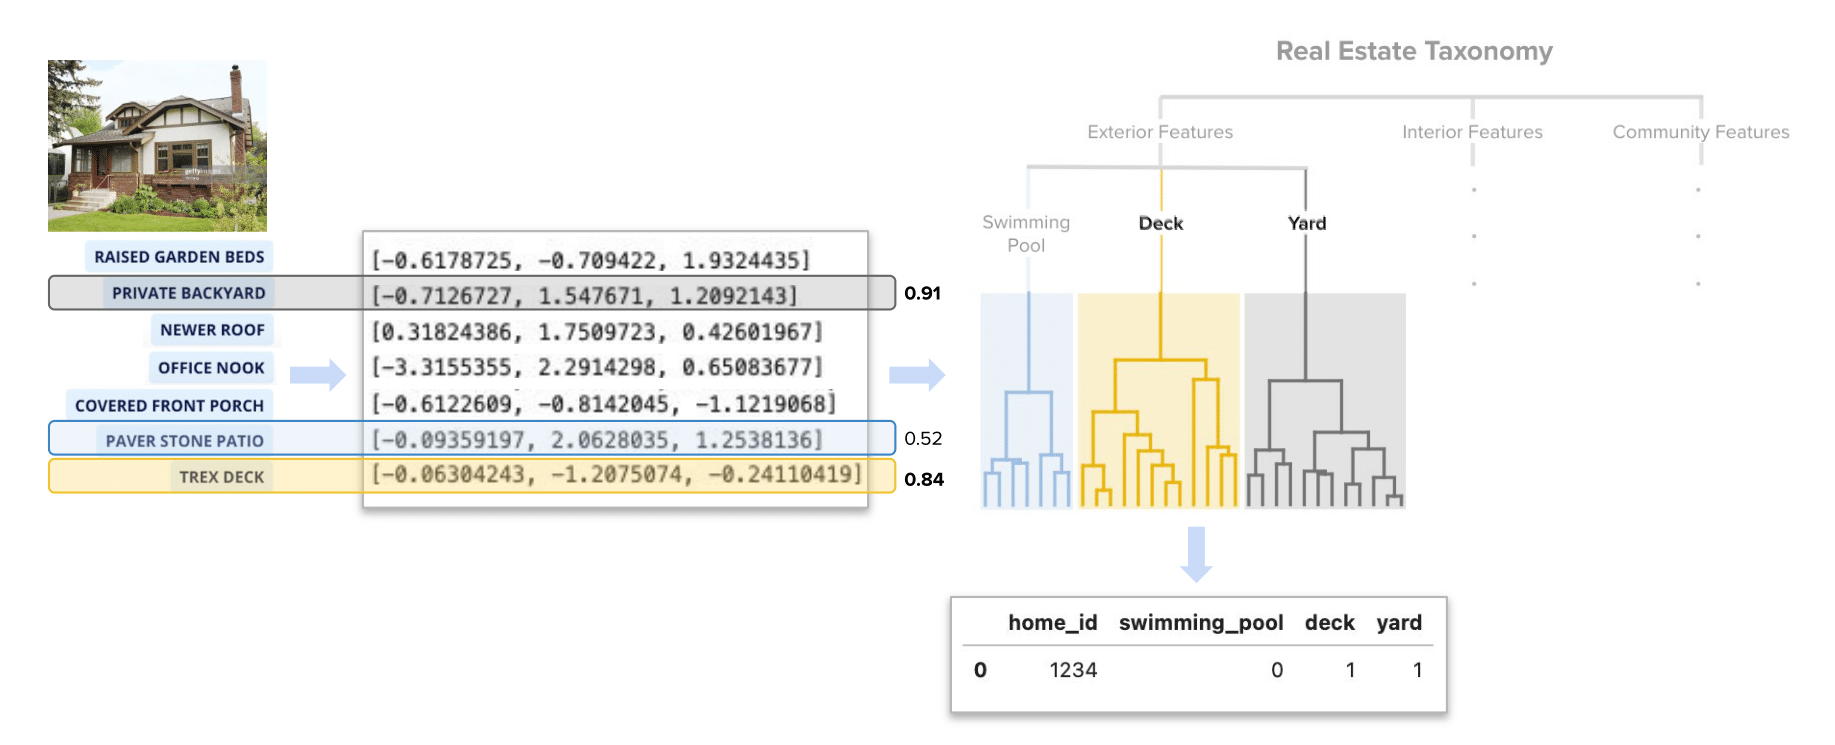 Figure 4b. A generalization of how the feature transform takes place from Home Insight tag to binary variable in our training and scoring data. Note that although we only display a handful of the most relevant Home Insight tags on the Zillow website, there are typically many more produced per listing and in practice we have access to all of the tags for potential featurization.
Exploratory data analysis of the impact of various similarity thresholds shows that as you loosen the similarity threshold you open up the risk of misclassifying new tags (Figure 5). For example, if we set our threshold to 0.6 (a relatively loose threshold) we would accidentally map all sliding glass door tags to the swimming pool category, which would be costly in terms of misclassifications given that sliding glass door is a relatively common Home Insight tag in this category.
These types of plots were very useful to us in identifying potential misclassifications (and the associated hyponym in the taxonomy that was facilitating the misclassification) and obtaining a feel for appropriate similarity threshold ranges to test for each new feature. This plot makes it obvious that the similarity threshold for swimming pool should be somewhere north of 0.9. There is a tradeoff worth keeping in mind, though, which is that as you tighten this threshold the feature becomes more sparse and if you over-tighten you will start to exclude tags that do in fact indicate the presence of a swimming pool. Luckily this is a tunable parameter and we have the tools we need to be able to strike a balance in this tradeoff.
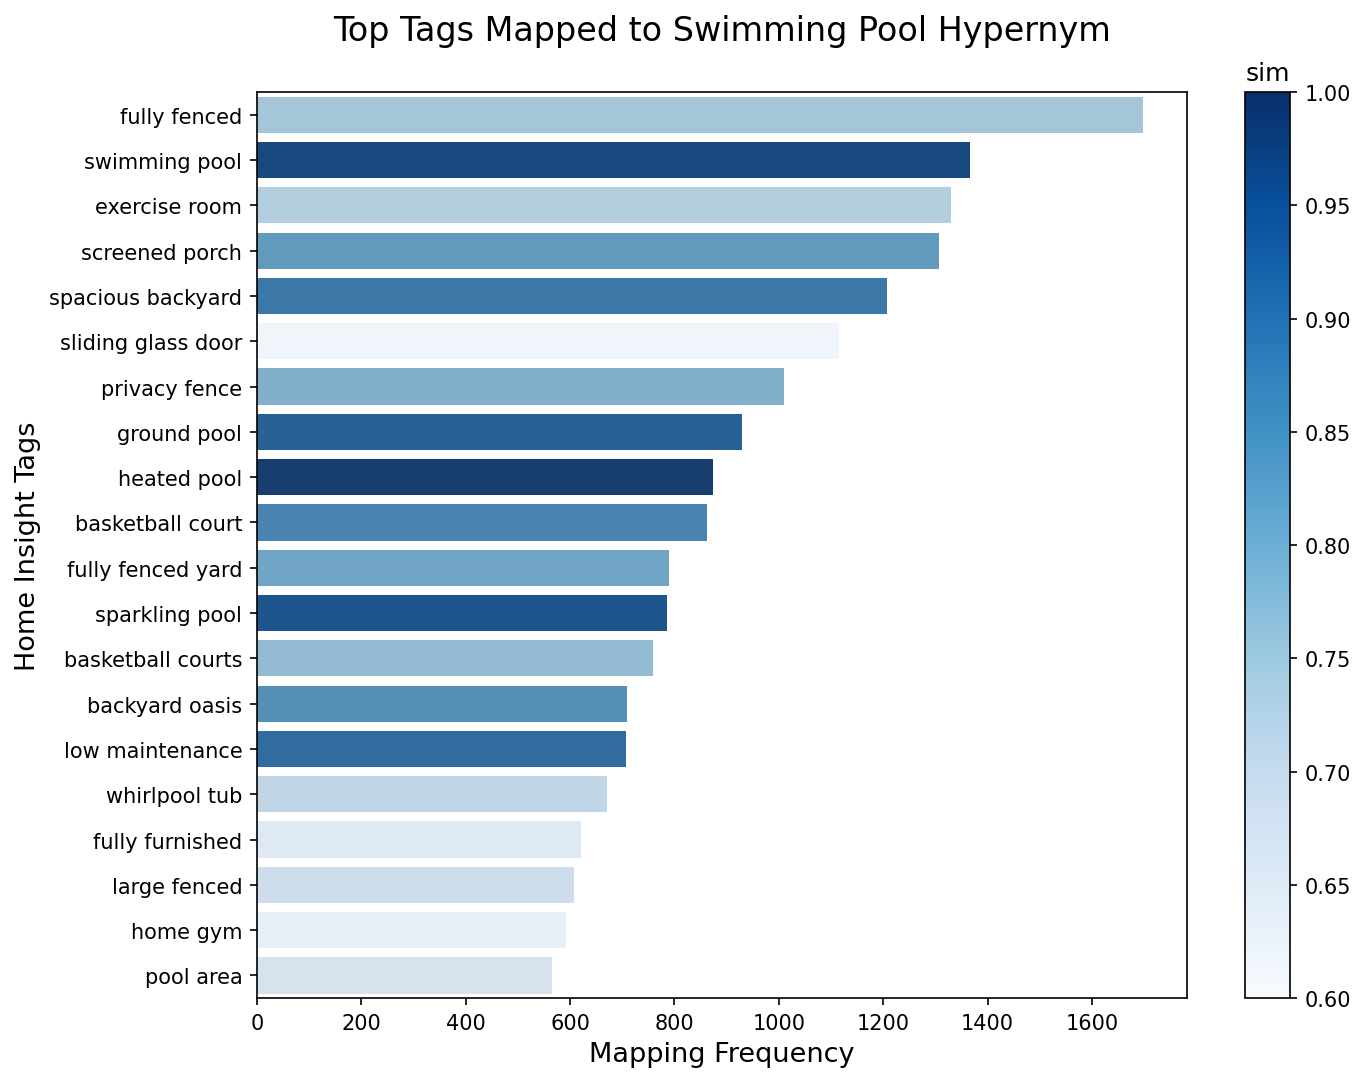 Figure 5. This figure plots the most frequent Home Insight tags being mapped to the swimming pool category, and shades them based on their similarity scores to the hyponym that was their nearest neighbor within the Real Estate Taxonomy. Notice that as one tightens (increases) the similarity threshold, fewer misclassifications result.
Testing listing description features in the Zestimate
In our testing, we used the above methodology to create a large set of new features spanning various categories to test in the off-market Zestimate model. We started with a residuals analysis whereby we compare our predicted Zestimate values to observed sale prices. We calculated the residuals (predicted Zestimate valuation minus actual sales price) over a period of a few months from our off-market Zestimate valuation model and used a combination of linear modeling and feature importance analyses to determine whether any of the new features had signal. A few popped out consistently across all our tests as providing a signal in predicting our own residuals.
In the next step we formally tested the new features in the Zestimate model. We do this by joining the new features to training and scoring data, being careful to only add the features as of the date we saw them in the historical listings. Thanks to our stellar AI Platform team, we leverage Kubeflow to run the Zestimate valuation in a backtesting framework, making experimentation easy. We ran experiments across a handful of months where each date has a control (same as current production) and multiple experimental runs.
In our backtesting, we typically use end-of-month (EOM) inference dates. In this setup we pair predictions from each EOM model with transactions that occurred in the following month. For instance, sales that occurred in the month of October would be paired with predictions from a model trained on September 30th. We can append those sales pairs together to create our validation dataset and compute performance metrics.
Whenever testing changes to the Zestimate valuation, we like to look across a range of metrics that allow us to get a sense for any improvements or degradations of accuracy (e.g., one accuracy metric is aggregation of absolute percentage error), bias (e.g., aggregations of percentage error), and outliers (e.g., percentage of absolute errors that are >= some pre-specified error rate).
Fortunately we found consistent results across our residual modeling and Zestimate valuation backtesting. These results include:
- Identifying broader categories of features that our current version of the Zestimate valuation is clearly missing and would benefit from including
- Including features which intuitively add value to a home improves Zestimate valuation bias on the homes for which we have listing descriptions:
- We found that we were previously underpredicting the Zestimate valuation of the set of homes that received these new features (e.g., the set in which these new features were flagged as present in their listing description).
- On the contrary, we were previously overpredicting the set of homes that did not receive these new features (e.g., these new features were not mentioned in a home’s listing description)
What’s next?
We’re very excited by these results and are planning next steps. It is standard protocol to test any new releases with a full multi-year backtest. This requires some set up work but is soon to come. If all goes well, we’ll deploy these new features in an upcoming version of the Zestimate valuation.
There are exciting extensions to this work as well. Using listing description extracts in the production version of the Zestimate valuation would require building a new data pipeline where we ingest Home Insights data from our Personalization team, featurize the tags and incorporate them into our training and scoring data. Once that is complete, it will be easy to test new listing description features moving forward.
These features could be useful to incorporate into other models at Zillow, AVMs or otherwise, and could also help us with data resolution efforts. There are certain features that either disagree between sources or are recorded differently per county and are thus relatively “dirty” features. These new features could be used to help resolve differences between various data sources.
The impact of this work extends internally to teams that use the Zestimate valuation downstream as a basis for their work. One such example would be our Housing Metrics team, whereby improving the Zestimate valuation improves monthly housing market metrics that we produce and share publicly. Another such example is proposed interactive buyer and seller tooling from Zillow that will benefit from an accurate home valuation that considers a richer feature set and user updates to those features.
Most importantly, the impact of a more precise Zestimate valuation extends externally, as well. The original and ongoing goal of the Zestimate valuation was and is to exploit Zillow’s wealth of data to provide consumers engaging in the housing market with the ability to establish reasonable market value on their own. Up until now, we have not utilized listing description text in any way to help inform a home’s value estimate. This work changes that, improving our accuracy by increasing the data that we are leveraging in the Zestimate valuation.
Ultimately a more accurate and unbiased Zestimate valuation empowers people with better information about what their home or a home they are interested in is worth, from first time homebuyers dream shopping, to long time homeowners looking to make their final move and everyone in between.
Acknowledgements
Thank you to Anish Khazane (Applied Scientist, Zillow Personalization AI) who played a central role in pulling off this project, from conception, throughout offline research, to facilitating formal backtesting of these new features within the Zestimate model by helping backfill Home Insights tags over historical listing descriptions. We are grateful to him and the Zillow Personalization team for supporting this cross-team collaboration and look forward to future Zillow Valuation-Personalization partnerships. Thank you also to Sinan Zhao (Senior Machine Learning Engineer, Zillow Valuation) for his work designing the new data pipeline that will be necessary to pull these features into our AVMs and eventually productionize this work.
Footnotes
- This is an artificially created Zillow home details page.
- This Medium blog post by Kashyap Kathrani provides a good starting point for a comparison between Word2Vec, GloVe, BERT and methods used to derive text embeddings.
- Thank you to Anish Khazane and Zachary Harrison for their impressive work developing Zillow’s Home Insights and Real Estate Taxonomy. Please read more about Home Insights at their Zillow AI/ML blog post.
- Harrison, Z. & Khazane A. 2022. Taxonomic Recommendations of Real Estate Properties with Textual Attribute Information, RecSys ‘22: Proceedings of the 16th ACM Conference on Recommender Systems, pages 479-481. https://doi.org/10.1145/3523227.3547386
- https://fasttext.cc/
Related Articles


Sign up for Zillow news updates
Subscribe to receive daily emails for the latest Zillow news and announcements, product updates and more.
%20--%3e%3cdefs%3e%3cstyle%3e%20.st0%20{%20fill:%20%23111116;%20}%20%3c/style%3e%3c/defs%3e%3cpath%20class='st0'%20d='M.67,84.17v-9.38L39.19,20.75v-1.12H1.34V4.67h62.64v9.38l-37.85,54.04v1.12h38.97v14.96H.67Z'/%3e%3cpath%20class='st0'%20d='M75.04,9.36c0-5.58,4.13-9.71,9.94-9.71s9.94,4.13,9.94,9.71-4.13,9.71-9.94,9.71-9.94-4.02-9.94-9.71ZM76.71,84.17V27h16.53v57.17h-16.53Z'/%3e%3cpath%20class='st0'%20d='M106.3,84.17V1.32h16.53v82.85h-16.53Z'/%3e%3cpath%20class='st0'%20d='M135.33,84.17V1.32h16.53v82.85h-16.53Z'/%3e%3cpath%20class='st0'%20d='M161.79,55.58c0-18.42,12.62-30.37,31.71-30.37s31.71,11.95,31.71,30.37-12.73,30.37-31.71,30.37-31.71-11.95-31.71-30.37ZM208.58,55.58c0-9.49-6.25-16.19-15.07-16.19s-15.18,6.7-15.18,16.19,6.25,16.3,15.18,16.3,15.07-6.81,15.07-16.3Z'/%3e%3cpath%20class='st0'%20d='M246.32,84.17l-17.2-57.17h16.86l11.61,40.64h1.12l10.16-40.64h16.53l10.94,40.98h1.12l11.39-40.98h16.41l-17.31,57.17h-21.55l-8.71-37.85h-1.12l-8.6,37.85h-21.66Z'/%3e%3cpath%20class='st0'%20d='M362.44,84.17V4.67h56.94v15.86h-38.3v17.53h33.5v14.51h-33.5v31.6h-18.65Z'/%3e%3cpath%20class='st0'%20d='M428.76,84.17V27h16.3v7.82h1.23c2.46-5.36,8.04-8.93,14.07-8.93,2.34,0,4.69.56,6.48,1.45v14.85c-3.24-1.45-7.03-2.12-9.38-2.12-7.26,0-12.17,6.03-12.17,14.85v29.25h-16.53Z'/%3e%3cpath%20class='st0'%20d='M471.64,55.58c0-18.42,12.62-30.37,31.71-30.37s31.71,11.95,31.71,30.37-12.73,30.37-31.71,30.37-31.71-11.95-31.71-30.37ZM518.43,55.58c0-9.49-6.25-16.19-15.07-16.19s-15.18,6.7-15.18,16.19,6.25,16.3,15.18,16.3,15.07-6.81,15.07-16.3Z'/%3e%3cpath%20class='st0'%20d='M545.11,84.17V27h16.52v8.04h1.12c4.24-6.48,9.71-9.71,16.64-9.71,12.95,0,21.55,10.05,21.55,23.78v35.06h-16.52v-32.72c0-7.03-4.02-11.95-10.72-11.95s-12.06,5.25-12.06,12.51v32.16h-16.52Z'/%3e%3cpath%20class='st0'%20d='M617.13,65.74v-26.69h-8.04v-12.06h8.49l3.24-18.09h12.95l-.11,18.09h13.06v12.06h-13.06v26.02c0,4.8,2.9,8.04,7.59,8.04,1.56,0,4.02-.33,5.92-.78v11.84c-3.24,1.12-7.93,1.79-11.17,1.79-11.5,0-18.87-8.15-18.87-20.21Z'/%3e%3cpath%20class='st0'%20d='M686.58,84.17V4.67h34.95c19.43,0,31.93,10.27,31.82,26.69,0,16.3-12.62,26.8-31.93,26.8h-16.52v26.02h-18.31ZM704.89,44.08h15.07c9.16,0,14.85-5.02,14.85-12.73s-5.81-12.62-14.85-12.62h-15.07v25.35Z'/%3e%3cpath%20class='st0'%20d='M757.71,55.58c0-18.42,12.62-30.37,31.71-30.37s31.71,11.95,31.71,30.37-12.73,30.37-31.71,30.37-31.71-11.95-31.71-30.37ZM804.49,55.58c0-9.49-6.25-16.19-15.07-16.19s-15.19,6.7-15.19,16.19,6.25,16.3,15.19,16.3,15.07-6.81,15.07-16.3Z'/%3e%3cpath%20class='st0'%20d='M831.17,84.17V27h16.3v7.82h1.23c2.46-5.36,8.04-8.93,14.07-8.93,2.34,0,4.69.56,6.48,1.45v14.85c-3.24-1.45-7.03-2.12-9.38-2.12-7.26,0-12.17,6.03-12.17,14.85v29.25h-16.52Z'/%3e%3cpath%20class='st0'%20d='M874.16,55.58c0-18.2,12.62-30.37,31.04-30.37,15.52,0,27.36,8.71,29.25,22.22l-15.41,2.01c-1.45-6.25-7.26-10.61-13.62-10.61-8.37,0-14.74,6.92-14.74,16.75s6.25,16.75,14.63,16.75c6.59,0,12.17-4.35,13.73-10.5l15.52,1.9c-2.12,13.51-14.07,22.22-29.37,22.22-18.2,0-31.04-12.28-31.04-30.37Z'/%3e%3cpath%20class='st0'%20d='M944.73,84.17V1.32h16.52v33.39h1.12c4.35-6.25,9.71-9.49,16.64-9.49,12.95,0,21.66,10.05,21.66,23.67v35.28h-16.52v-32.83c0-7.03-4.13-11.95-10.83-11.95s-12.06,5.25-12.06,12.62v32.16h-16.52Z'/%3e%3c/svg%3e)
