Contextual, multi-armed bandit performance assessment


Figure 1: Multi-armed bandits are a class of reinforcement learning algorithms that optimally address the explore-exploit dilemma. A multi-armed bandit learns the best way to play various slot machines so that the overall chances of winning are maximized.
AI Helps People Find Their Dream Home
Everyday, millions of people start their search for a new home with Zillow. Home buyers parse through personalized listing recommendations and turn to Zillow Home Loans for a mortgage. Sellers look to Zillow Offers to sell their current home easily and on their timeline. Renters streamline their rental applications and payments in one convenient place.
At Zillow, we recognize that making each of these customer experiences delightful and concretely useful requires relevant, timely, and personalized customer touchpoints. We also recognize that achieving personalized, delightful experiences for 100s of millions of customers and 100s millions of homes every month requires a focused and sustained investment in artificial intelligence (AI).
Part of our investment in AI includes developing and deploying contextual, multi-armed bandits, a class of reinforcement learning algorithm that can quickly learn the best experience to present each individual customer, at large scale. This blog is a technical deep dive into two methods for offline evaluation of contextual, multi-armed bandits. Offline evaluation in a standard step in any machine learning model training that can help identify issues in the trained model and estimate the potential gains from deploying the model online.
What is a contextual, multi-armed bandit?
Multi-armed bandits are a class of reinforcement learning algorithms that optimally address the explore-exploit dilemma. Imagine that you are tasked with determining, out of several options, the policy to use for deciding which banners to display on your web site. You could start with randomly displaying, with equal probability, the candidate banners, and logging how often each is clicked by the users visiting the web page: this is the exploration phase.


Figure 2: A multi-armed bandit can learn the policy that decides which banner to display, depending on a user’s context. For example, a banner may be placed at the top or at the bottom and exhibit different stylistic characteristics, based on the user’s preferences.
With sufficient banner impressions and user clicks, the multi-armed bandit learns a policy, also known as a model, which is a probability distribution over the banners (the arms) that favors the most effective ones. You can then exploit the learned policy when a user navigates to the web page: the bandit selects randomly which banner to display according to the learned policy’s probability distribution; at the same time, you keep collecting data and update the policy accordingly. This process is different from the standard A/B test, which declares a single winner at the end of a time-limited experiment. Instead, the bandit continuously experiments (explores) and updates the learned policy. Eventually the policy will converge to a distribution that strongly favors the best banner (exploit).
Now, let’s say that you believe that the type of web page (e.g. a property details page on Zillow, a search page, etc.) a user is viewing and the frequency of web site visits of the user are important factors that should be taken into consideration by the policy. In this case, the bandit’s policy is contextual to these additional inputs, and you use a contextual, multi-armed bandit to learn the probability of displaying banners on your website, conditioned on the additional information.
What is off-policy evaluation and why do we need it?
In practical settings, training a bandit offline involves the typical train/cross-validation/test cycle. A difficulty arises, however: the underlying distribution of the available, logged data is usually different from the policy the bandit needs to learn. For example, when you first launch the banner experiment, you may assign each banner equal probability of being displayed, and learn from the responses a policy that, one hopes, will not be uniform over the banners. In other words, the policy for the exploration phase is different from the policy that the bandit must learn to properly operate in the exploitation phase.
So, how do we evaluate the bandit model when the ground truth data are collected under a different policy? Researchers have proposed off-policy evaluation to address this challenge. In this post, we discuss the properties of two off-policy evaluation methods: the direct matching (DM) and the inverse propensity score (IPS) methods. In our banner ad example, DM compares the click rate of the logged data and the bandit model for the cases when the banner selected by the bandit matches the banner clicked by the user. In the IPS method, the click rates from all banners are considered, not just the ones where the two policies match, with appropriate weights.
Before continuing with evaluating the statistical bias and variance properties of the DM and IPS methods , let’s connect our banner ad example to more general nomenclature that we will use going forward. The input features that we deem important ( e.g. the type of page and frequency of visits) are called the context; the selection of Banner 1 vs. Banner 5, is called the action or treatment; the observed click/no click outcome is called the reward. A more general term for Banner is treatment (because all sorts of experiments exist, not just banner ad optimization!) By logged data we mean the data collected outside of the bandit’s policy and which we use for evaluating the trained bandit model. The logging policy is the distribution of the treatments over the logged data, and the target policy is the distribution of the treatments that the bandit learns.
Problem Formulation
Let’s define some terms first:
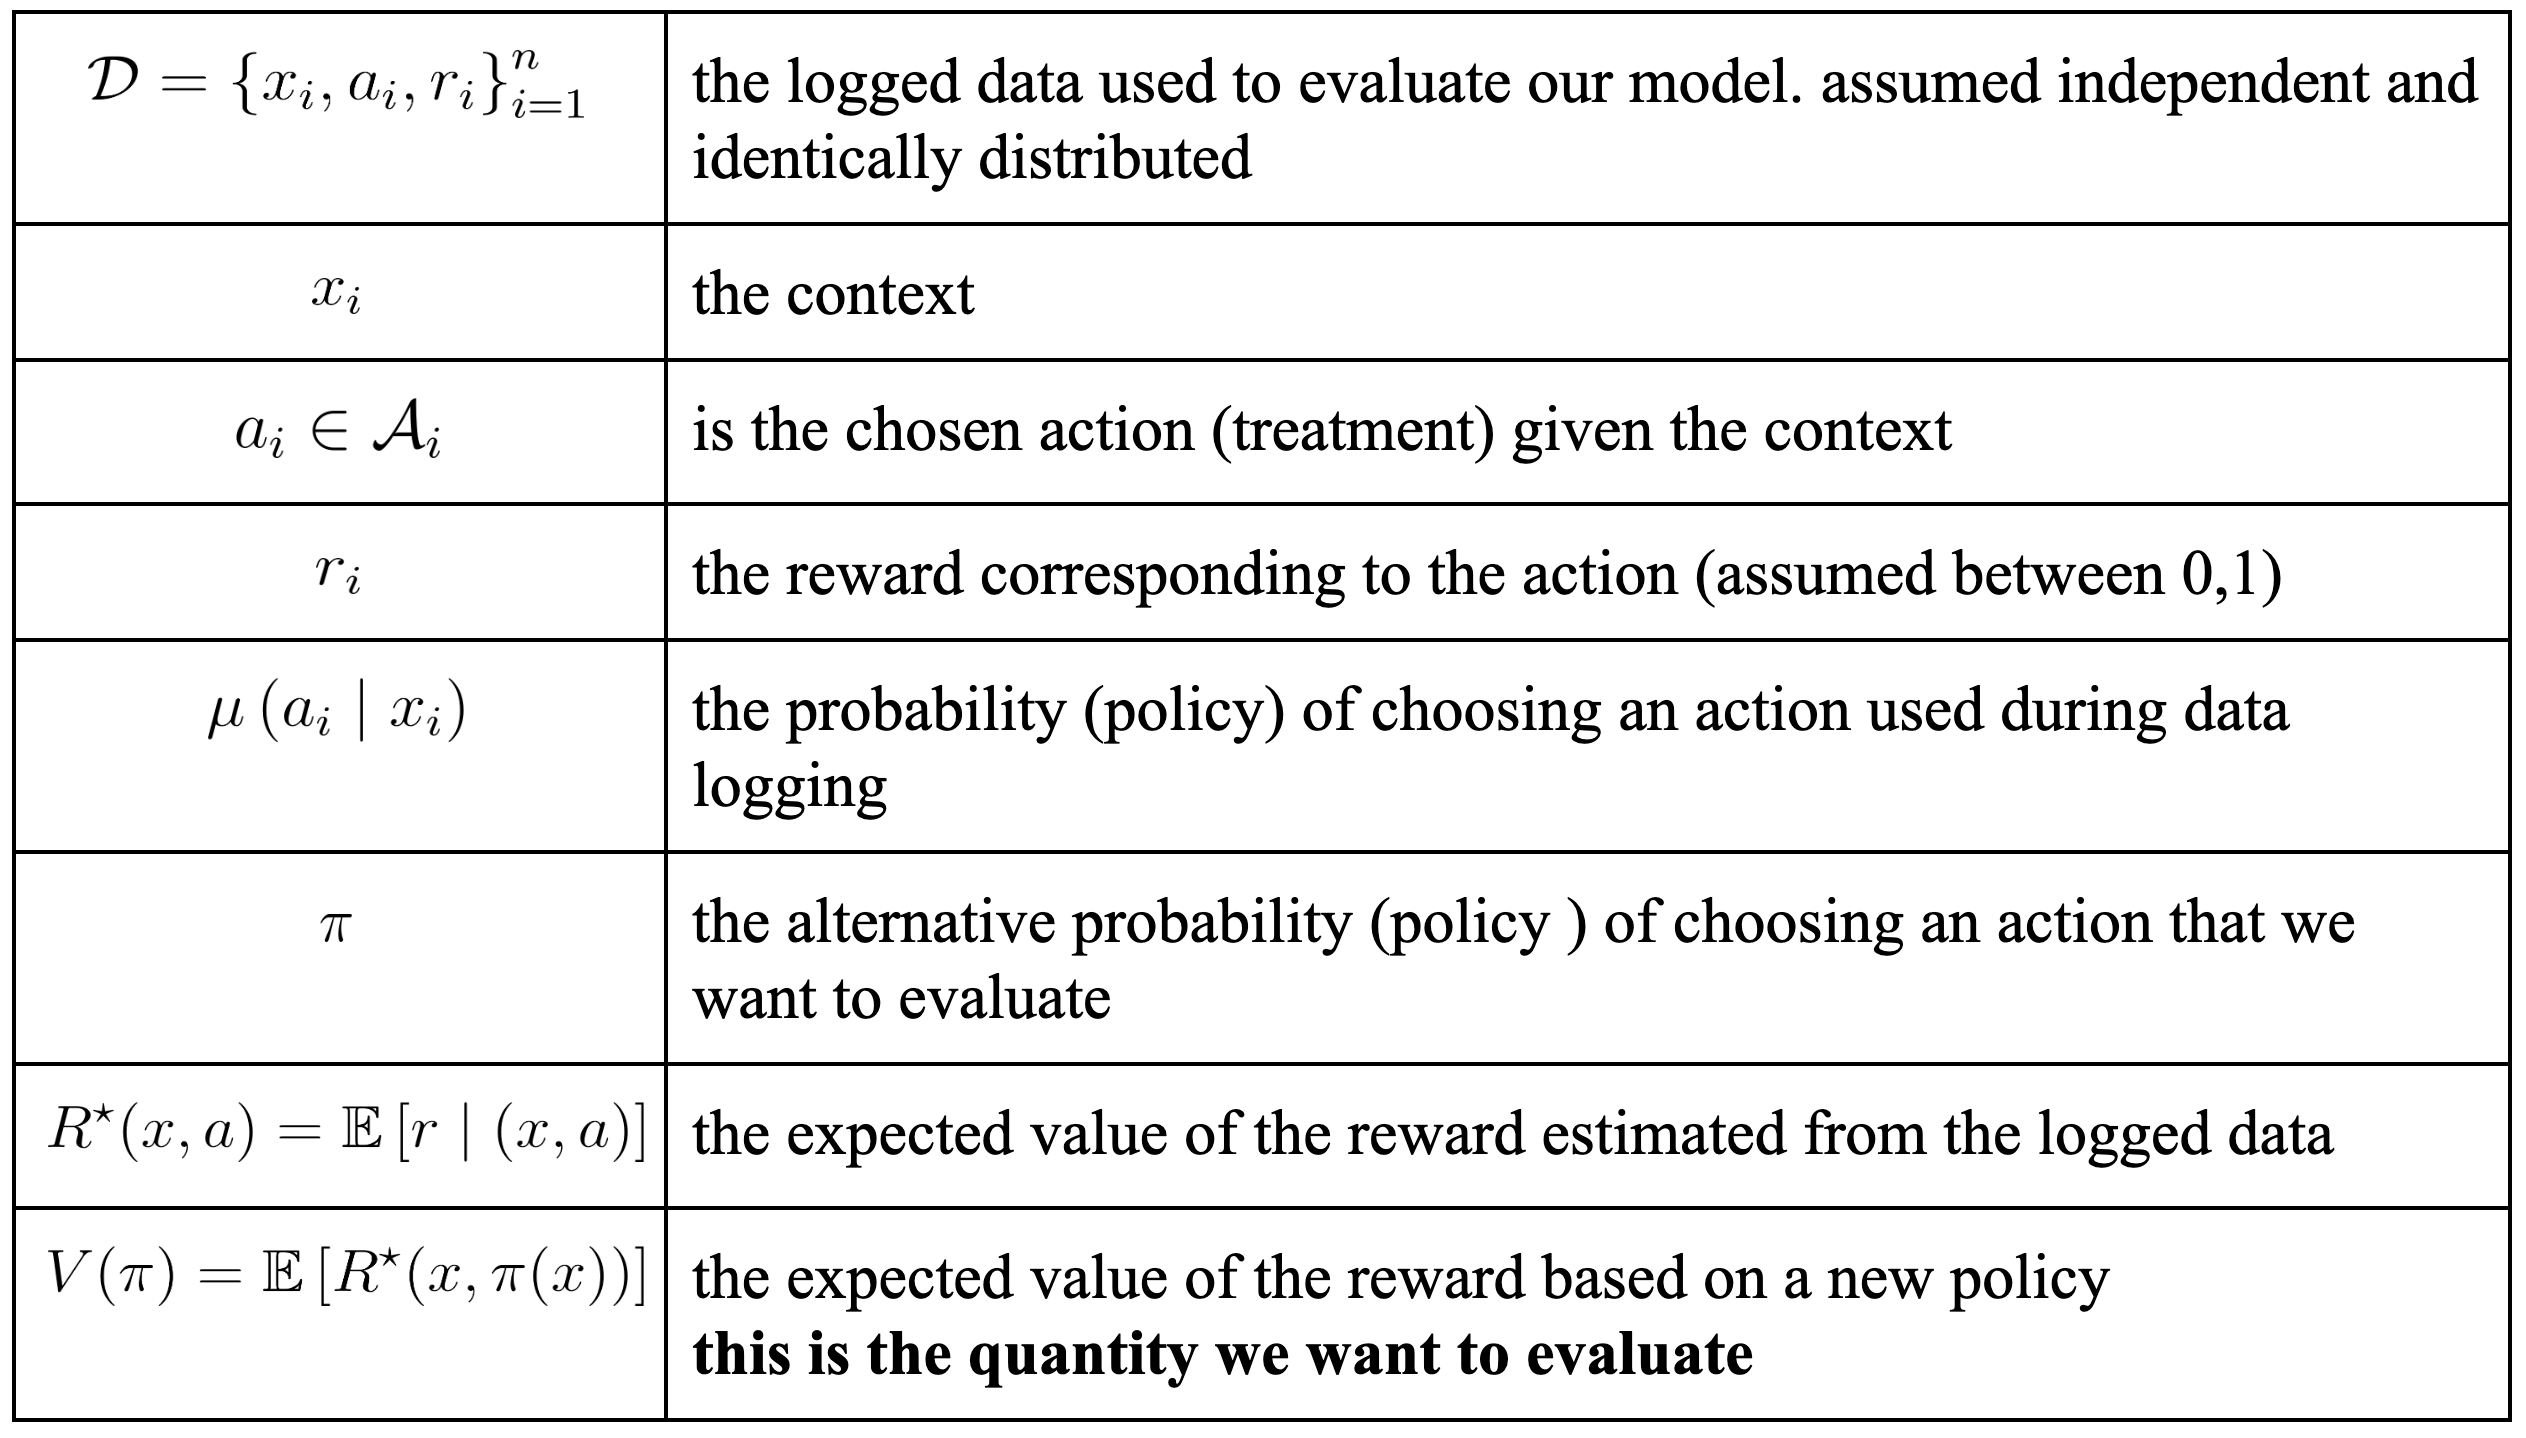

The goal of off-policy evaluation is to find a good approach to estimate


based on the logged testing data D. An estimator is called unbiased if its expected value equals the value being estimated:

Finally, we make the following assumption throughout the article.
Assumption 1: For any action and context, if

then
This means that the logging policy will cover all actions that the target policy can take.
In the following we explore the variance and bias of the DM and IPS methods: specifically we
look at the relationship between the variances and between the expected values of the two methods:

and

Definitions of Direct Matching and Inverse Propensity Score Methods
Let


be the actions taken by the policy when applying it on


from logged dataset


Define

where 1 is the indicator function. Then, the DM estimator is defined as the following:

When applying DM, we just first screen out the data in which logging policy µ and target policy ???? choose the same action, and then take the average reward over them.
The IPS estimator is defined as the following:

It is the average of a weighted sum of all rewards, where the weights are chosen so that the resulting expectation is the reward under target policy ????.
IPS is unbiased, DM is biased
Under Assumption 1, the IPS is unbiased:
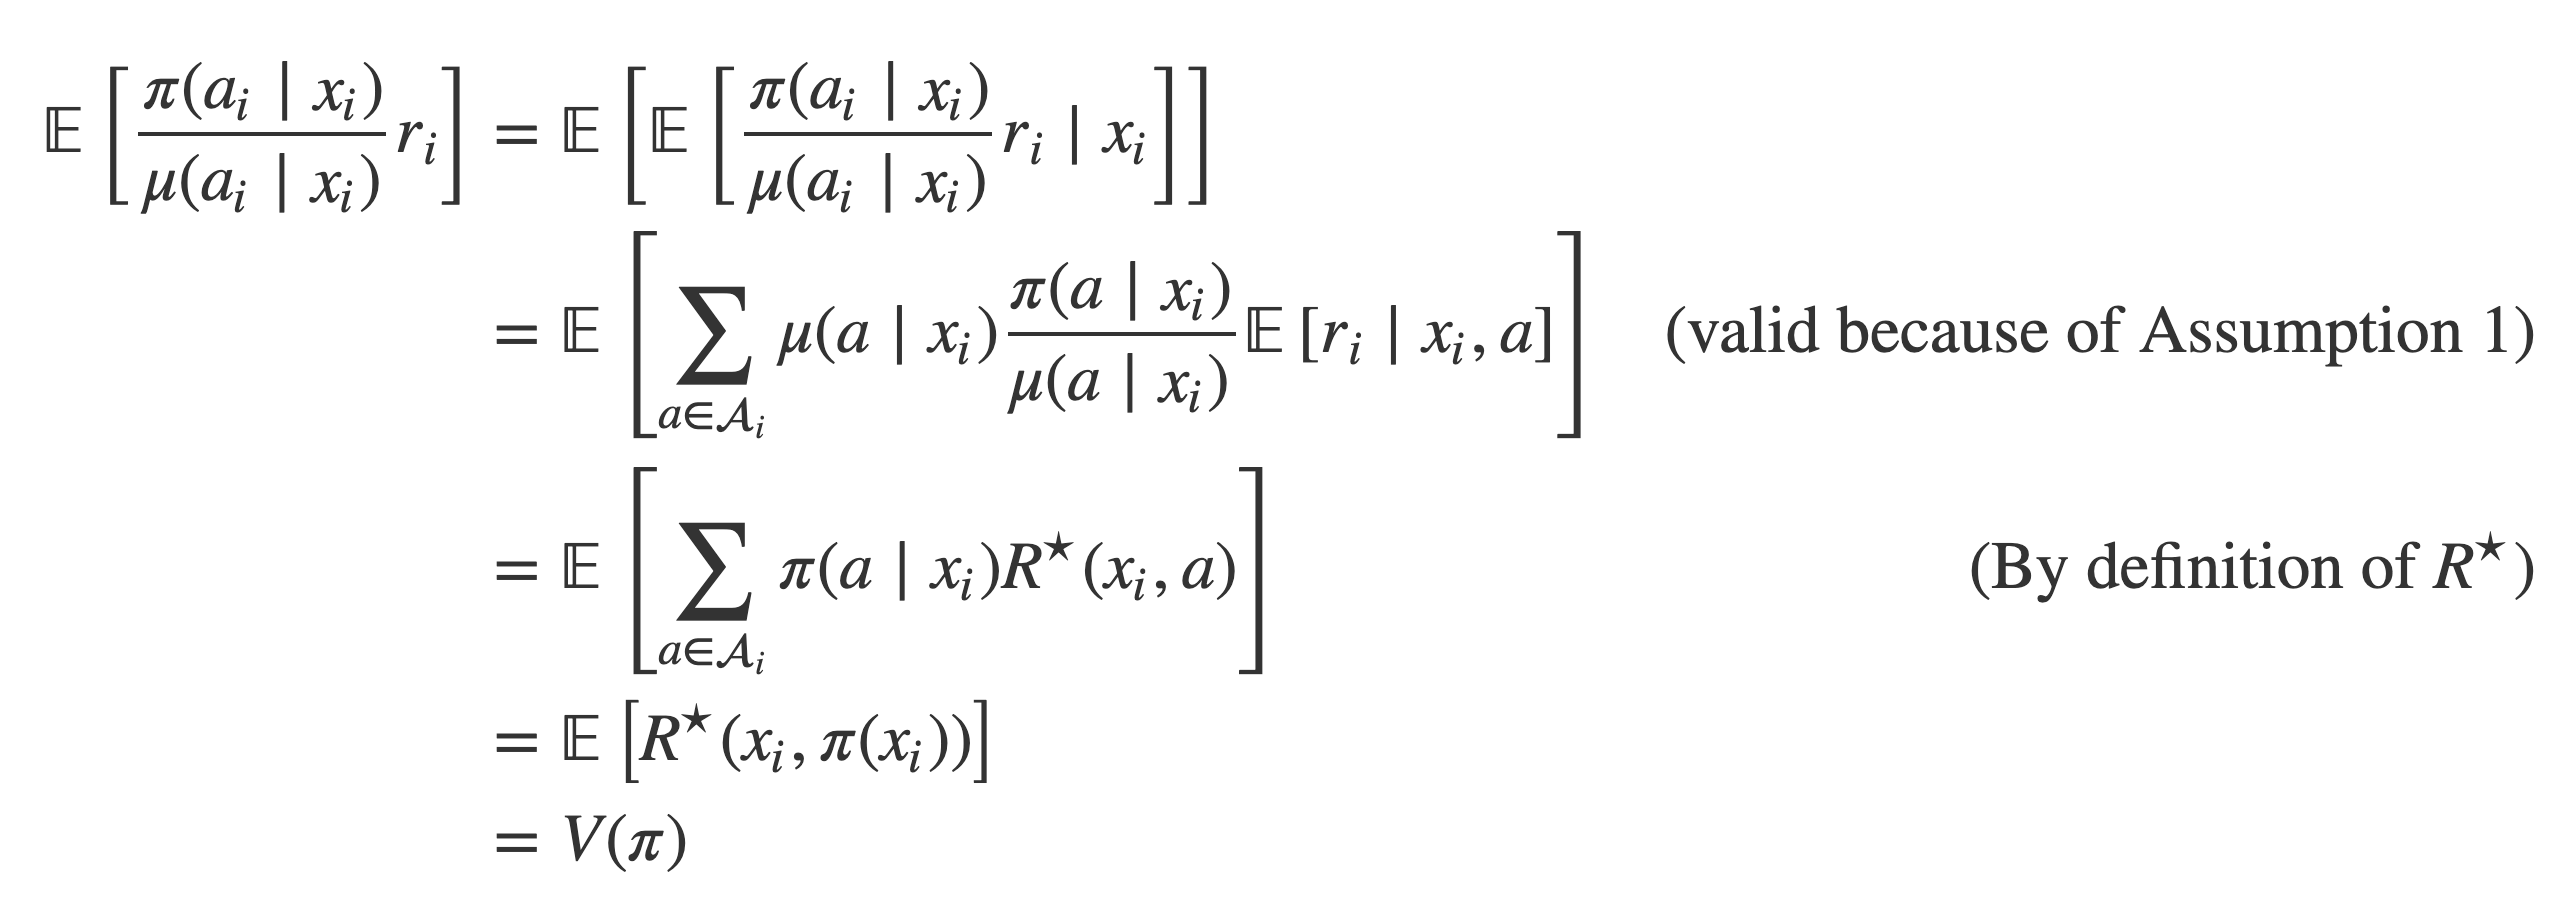

which shows that IPS is unbiased.
Under Assumption 1, DM is not guaranteed to be unbiased, as can be shown by the following argument. Consider a simplified case where there is no context dependency, i.e.a non-contextual multi-armed bandit problem. Furthermore consider that the target policy, logging policy and reward are all independent, distributed according to a Bernoulli distribution with parameter p=0.5, which is uniformly binary. Suppose we only collect 2 data points, that is, n=2. Obviously, in this case, we can simply have

However, for the DM method we have that

which shows that the DM method can be biased.
IPS Has Lower Variance Than DM … mostly
Through numerical experiments, we show that the IPS method has lower variance than the DM method in practical cases. First, let’s define the per-user entropy (PUE). For some policy ????, the PUE is defined as

where the denominator scales the PUE between [0,1]. Note that the PUE is an average measure of the exploration/exploitation balance for policy


A high entropy, and therefore a high PUE, means higher uncertainty about the treatment selection for context xi: more exploration is at play. Conversely, a lower entropy, and therefore a lower PUE, means lower uncertainty about the treatment selection and the bandit selects a specific treatment for a specific context more consistently: more exploitation is at play.
We evaluate the standard deviation of the IPS as a function of the PUE on a dataset collected from a recent banner ad experiment at Zillow. The evaluation process is as follows:
- Split the dataset into N subsets
- Compute the DM score and IPS for each of the N subset, for a given bandit model.
- Compute the moving standard deviation over their N computed scores.
We compare 8 different contextual, multi-armed bandit models based on random forests, for two different data sets, for different values of the PUE.
We compare 8 different contextual, multi-armed bandit models based on random forests, for two different data sets, for different values of the PUE.

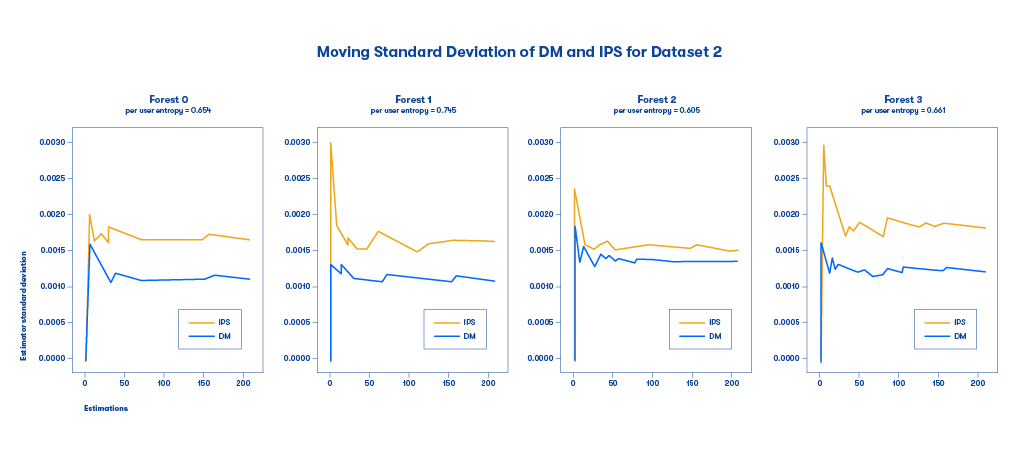
Figure 3: The standard deviation for the DM and IPS methods for different random forest-based multi-armed bandit models for low/medium PUE.
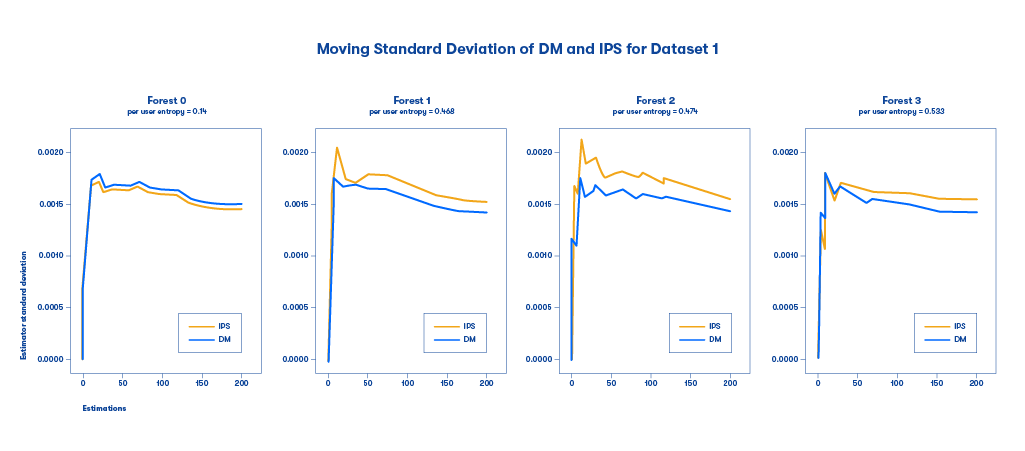
Figure 4: The standard deviation for the DM and IPS methods for different random forest-based multi-armed bandit models for medium/high PUE.
We can see that in most cases, the IPS method exhibits lower standard deviation than the DM method. Here, an interesting finding is that for models with low PUE (which means little exploration), IPS and DM tend to have similar deviations, while for models with larger PUE (which means much exploration), DM tends to have much higher deviations than IPS. The summary is shown in the following plot.

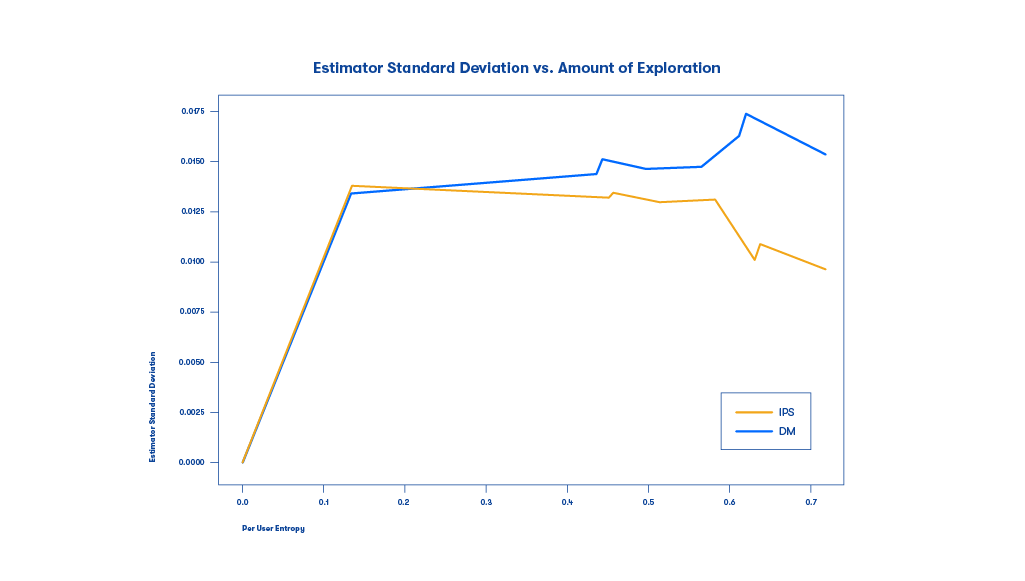
Figure 5:The DM and IPS standard deviations as a function of the PUE. DM and IPS have similar standard deviations under policies with low exploration and high exploitation (low PUE); conversely, the IPS has lower standard deviations when the PUE is higher and the bandit is balancing exploration with exploitation.
Conclusion
We have seen that the bias and variance properties of the IPS make it more widely applicable as a method for assessing the performance of trained contextual, multi-armed bandits. Across the spectrum of exploration/exploitation the IPS gives similar or lower standard deviation than DM, which means that it gives us more certainty about the performance of the bandit than the DM. We have also proven theoretically that the IPS is unbiased, and the DM is biased. Therefore, in most cases, IPS will serve as a better model evaluation method than DM. In practical settings, it is important to be able to assess the model performance offline before the model is deployed, and having tools like the IPS allows us to assess bandit models faster and with more confidence.