Using AI to Understand the Complexities and Pitfalls of Real Estate Data

Written by Ondrej Linda on April 17, 2024
Introduction
AI is at the core of how Zillow helps people find their next home and how we turn data into insights and engaging user experiences. Our nearly 200 million unique monthly users use these AI-powered experiences when they see the estimated value of their property (powered by the Zestimate model), when they search for new listings using Natural Language Search, are shown Personalized Home Recommendations, or virtually tour a home with Listing Showcase. These are just a few examples of where we use AI to “turn on the lights' for our customers and empower them through greater knowledge and understanding of the complex and constantly changing real-estate market.
AI is a powerful tool that can help us to achieve that goal and help our customers unlock their life’s next chapter, but it can also reproduce and potentially exacerbate bias. As such, while developing AI systems like those listed above, we must simultaneously consider both the opportunity that AI affords, as well as our responsibility to adhere to Zillow’s AI Principles and Responsible AI practices.
Real estate data is inherently affected by past inequalities and by the history of discrimination and segregation in housing, mainly with respect to race. Even without knowing the race of the buyer or seller, many common attributes can function as strong proxies. For instance, the well-documented wealth gap between Black and White families and the related gap in the home values in majority non-hispanic White and majority Black census blocks suggests that price is a strong proxy for race.
Our goal in this post is to understand disparities in the market as captured in an important source of real estate data. For the sake of our discussion, we will focus on the text in real-estate listing descriptions, one of the primary modalities for Zillow’s customers to learn about the details of a specific home. These descriptions are often written by listing agents to highlight the unique selling points of the home and to help it stand out. With recent advancements in natural language processing (NLP) and large language model (LLM) technologies, this kind of text is now easier to digest and understand for analysis. Understanding whether this type of input data can function as a proxy for protected classes is a challenging but important task, because it can turn on the lights about the remnants of historical inequalities in the real estate domain, as well as inform the need to conduct subsequent fairness and bias audits of any AI system using this data to create new experiences or make automated decisions as well as.
While there is a risk of AI systems reproducing harmful bias if they’re not designed and deployed responsibly, AI models constitute effective tools to help us visualize, analyze, and understand potential bias, through the lens of correlations of our data with protected classes.
In the rest of this blog post, we will outline how we went about creating a corpus of listing descriptions for homes in neighborhoods with distinct, dominant racial demographics. We will then explore how simple text statistics, key phrase patterns, and topic analysis can be used to understand differences and potential disparities in their semantic meanings.
Listing Descriptions
The text in real-estate listing descriptions contains valuable information about the unique attributes and highlights of each home. Together with home attributes (e.g., number of bedrooms, square footage, lot size) and the listing images, they can help a customer understand and evaluate each home in a multi-modal and holistic way. Given the advances in NLP and LLM technologies, the listing description text itself is also increasingly directly used by AI systems. With publicly-available, pre-trained large language models (LLMs) it is relatively straightforward to pass listing descriptions into an LLM and ask for unique attributes to be automatically extracted. It is also easy to process the text of a listing description via an embedding model and obtain a numerical representation of its semantic meaning. This representation can then be used to look up similar items or as the representation for input to a downstream ML system.
At Zillow, the listing description text can be found on each Home Detail Page (HDP). Currently, we display the listings description text (red box in Figure 1) together with extracted Home Insights tags (blue box in Figure 1). For the analysis in this post we have collected listing descriptions from all actively listed single-family homes available on the market on January 25th, 2024.
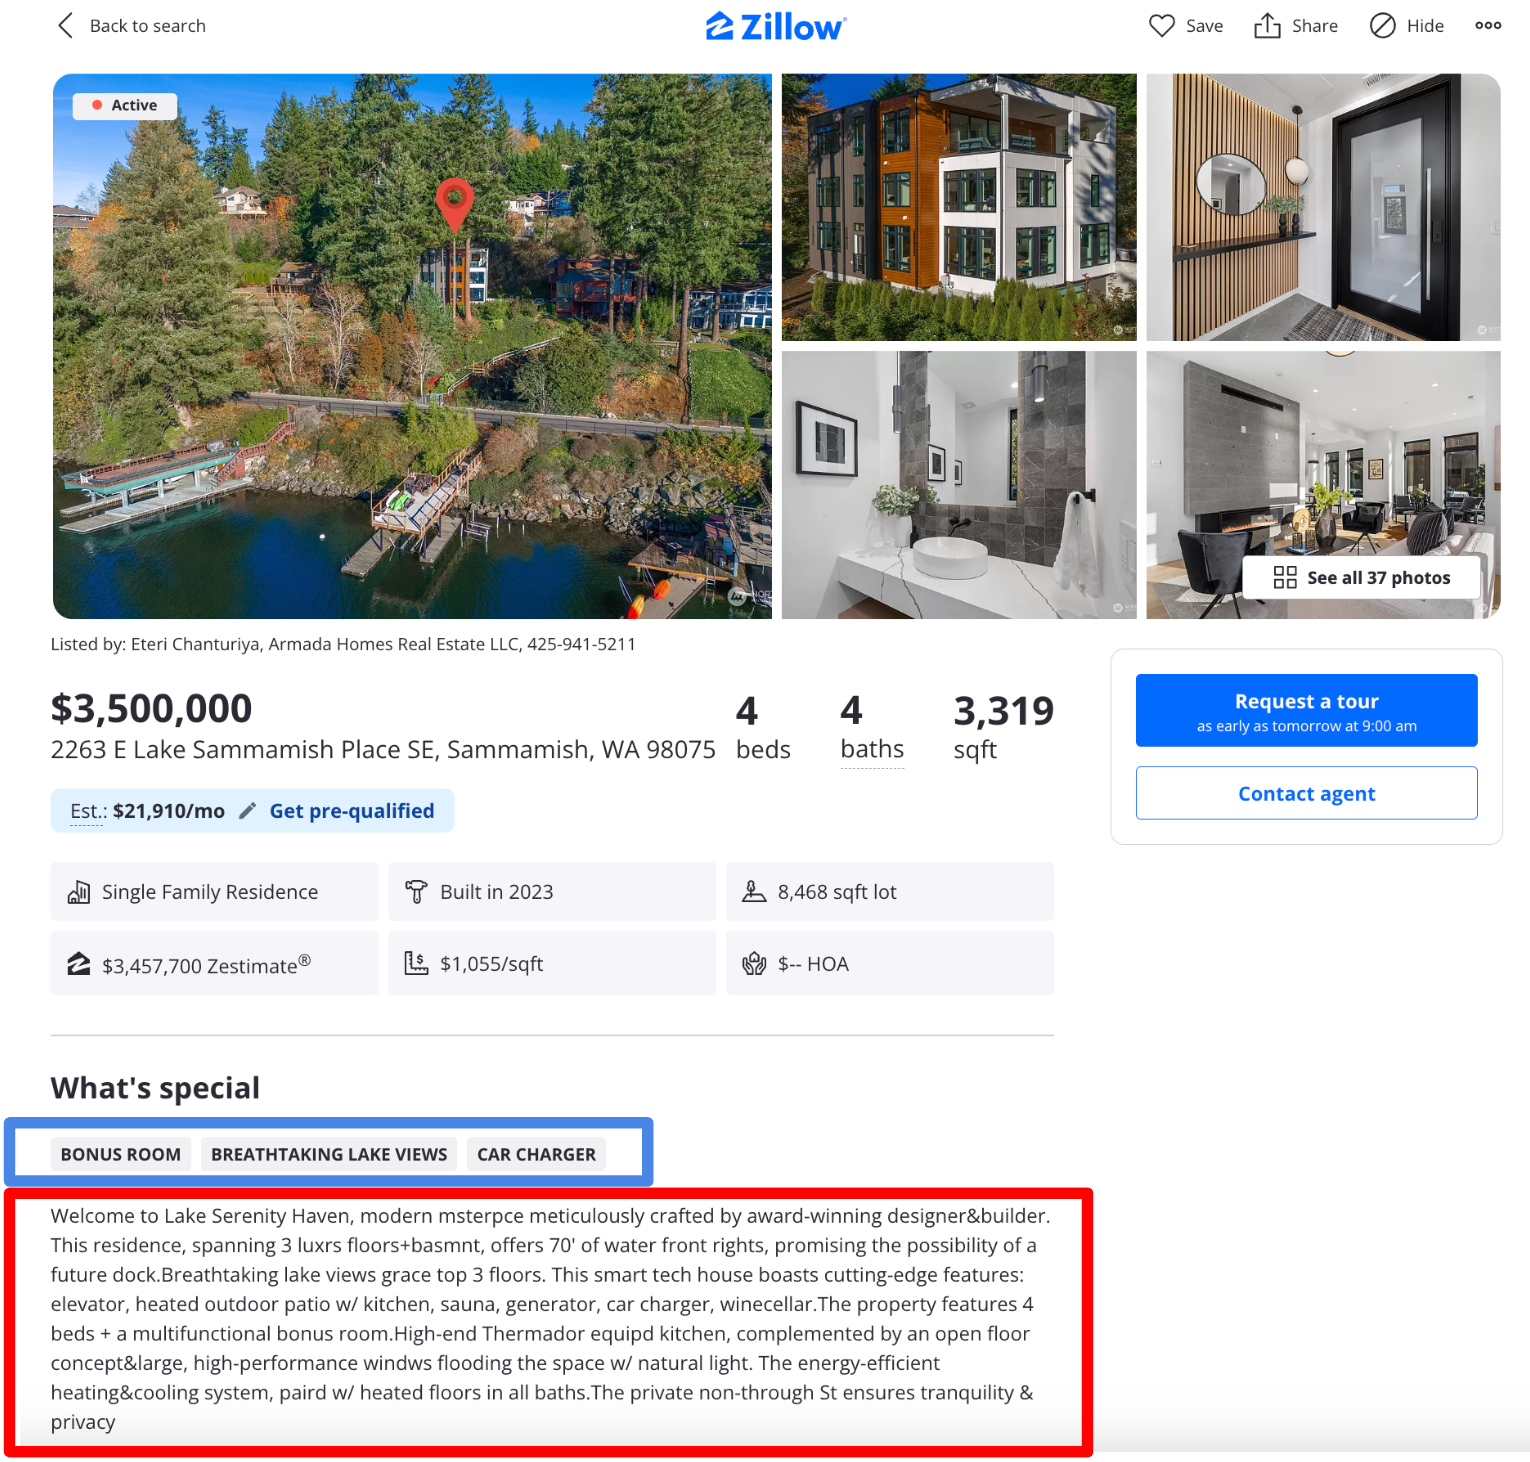 Figure 1. Home Detail Page with Listings Description Text (Red) and HomeInsights Tags (Blue).
Racial Demographic Category Selection
In the real estate domain specifically, we are concerned with upholding Fair Housing and Fair Lending regulations and avoiding any potential discrimination or harm based on the protected attributes of the customers. Bias in the output of an AI system might occur as a result of input data (i.e., in the features or independent variables) that function as proxies for protected classes, as result of training labels (dependent variables) having varying quality across protected classes, from the objective function we optimize, or the machine learning models we use. In this blog post we will focus on understanding whether complex and unstructured data, such as the text of real estate listing descriptions, might also function as a proxy for protected classes.
Since we are interested in analyzing the semantic difference between listing descriptions for homes in different locations with diverse dominant racial demographics, we first mapped each home to its corresponding U.S. census block based on its location. Then we computed the racial demographic feature for any given listing using the associated U.S. census population statistics of the area. More specifically, here we are focused on homes that are located in U.S. census blocks with at least 50% non-Hispanic-white population (Group A) and at least 50% Black population (Group B).
After labeling all listings with the respective demographic category of the block group in which they are located, the listings were grouped by county. To control for differences in the diverse geographical distribution of both demographic categories, only counties with at least one listing in both Group A and Group B were considered. This resulted in 534,490 listings in the majority non-Hispanic white group and 40,031 listings in the majority Black group distributed over 757 distinct counties. Figure 2 below shows counties with available listings in both Group A and Group B, with the size of each marker representing the total number of actively listed homes available in the corresponding county and the color of the marker representing the proportion of homes in majority Black neighborhoods within each county.
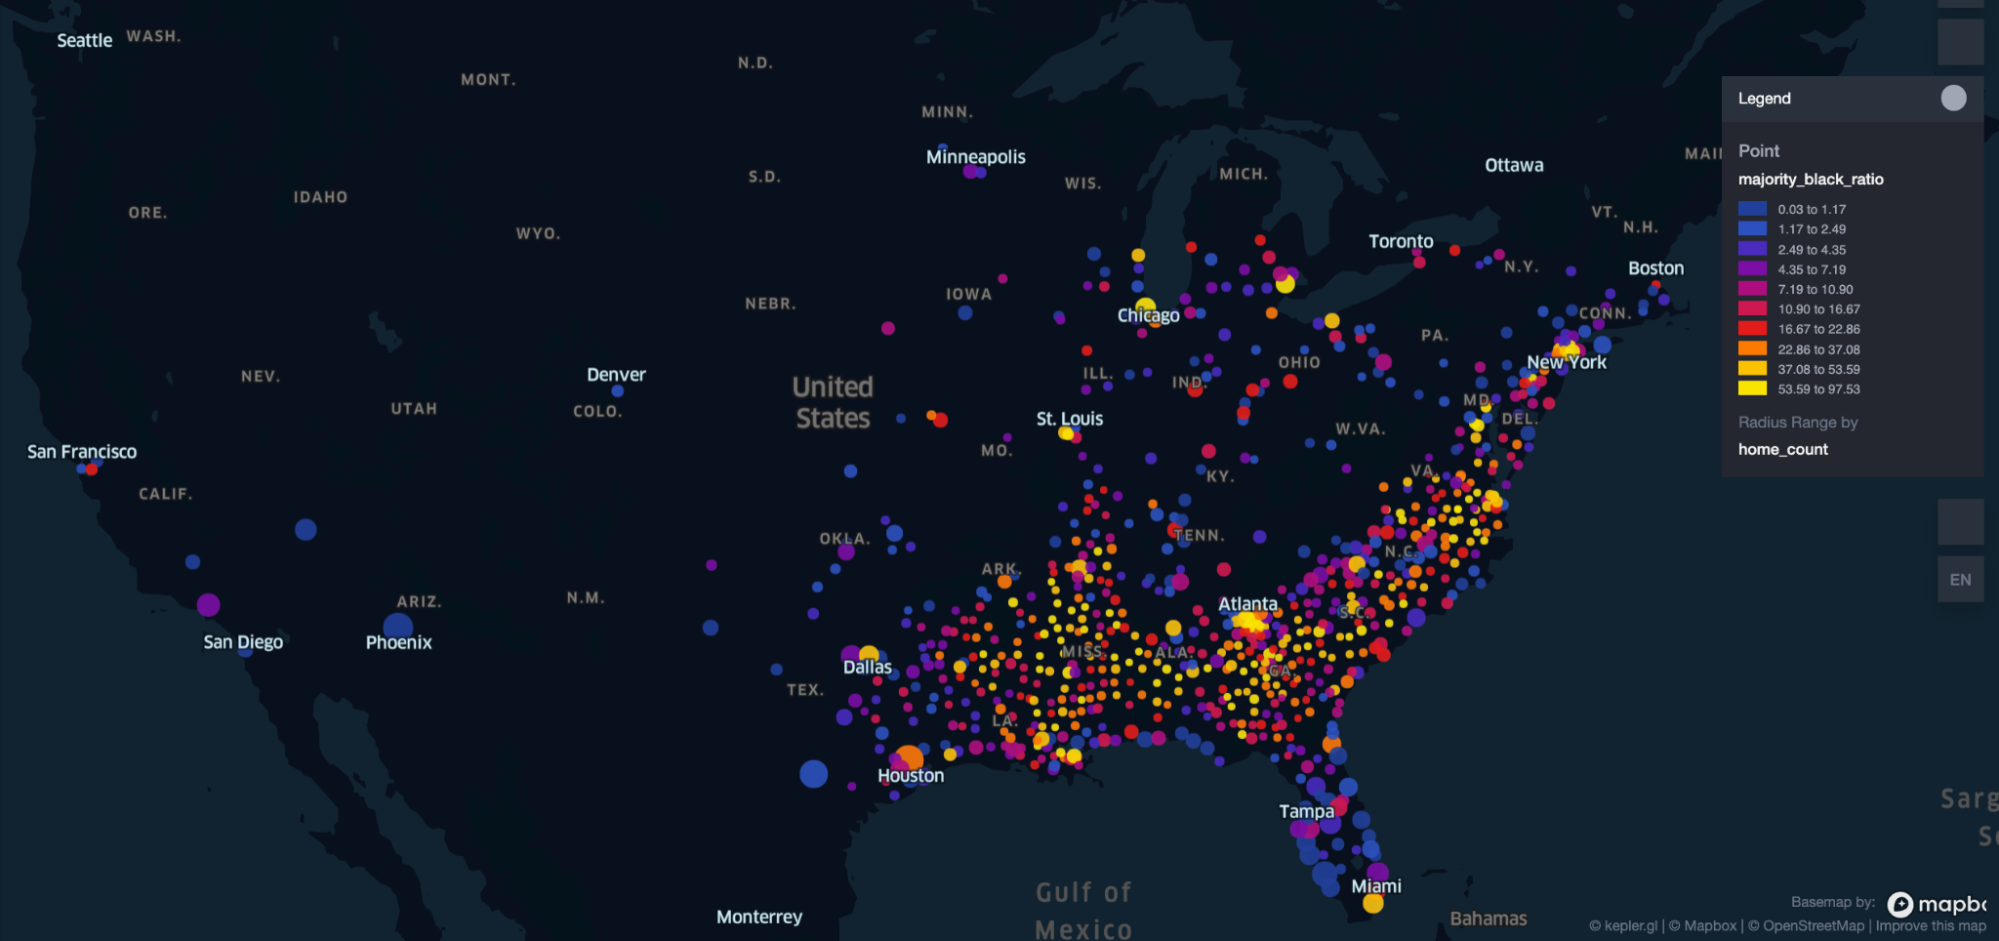 Figure 2. Geographical distribution of selected counties and the proportion of listings in majority Black neighborhoods
Analysis
In this section we explore three progressively more complex techniques (ranging from simple text statistics to more complex topic modeling) for understanding whether the two collections of listing descriptions are similar or different in terms of their semantic meaning.
Why does this matter and how could it be useful? With unstructured textual data being increasingly utilized as input to AI systems via the availability of powerful text processing and understanding tools, such as LLMs, it is important to analyze and understand whether text itself can constitute a proxy for protected classes. While this kind of proxy analysis is relatively straightforward to conduct for numerical and categorical features, such as the price of a home or zip code by computing correlation with demographic categories, it is more challenging to do so with unstructured data such as text.
Text Statistics
Before we leverage more complex machine learning algorithms for analysis, we will compute simple text statistics and see if a simple comparison is sufficient to differentiate the two collections of listing descriptions.
To do this we will pick a simple statistic of each listing description, such as the number of tokens. Here, a token corresponds to each individual word after splitting the text by white space and punctuation. Once the number of tokens has been computed for each listing description we can then compare the distribution of the number of tokens between the two groups.
Figure 3 (below) shows normalized histograms for Group A and Group B of the number of tokens in the listing descriptions - capturing the Probability Distribution Function (PDF) of the variable. It also shows the Cumulative Distribution Function (CDF) of the number of tokens in the solid curves. By plotting both the PDF and the CDF, we can easily see that listing descriptions from Group A tend to contain significantly more tokens. In fact, the average listing description in Group A has 144.03 tokens, while the listing description in Group B has only 102.17 tokens, which corresponds to a relative drop of -29.1%.
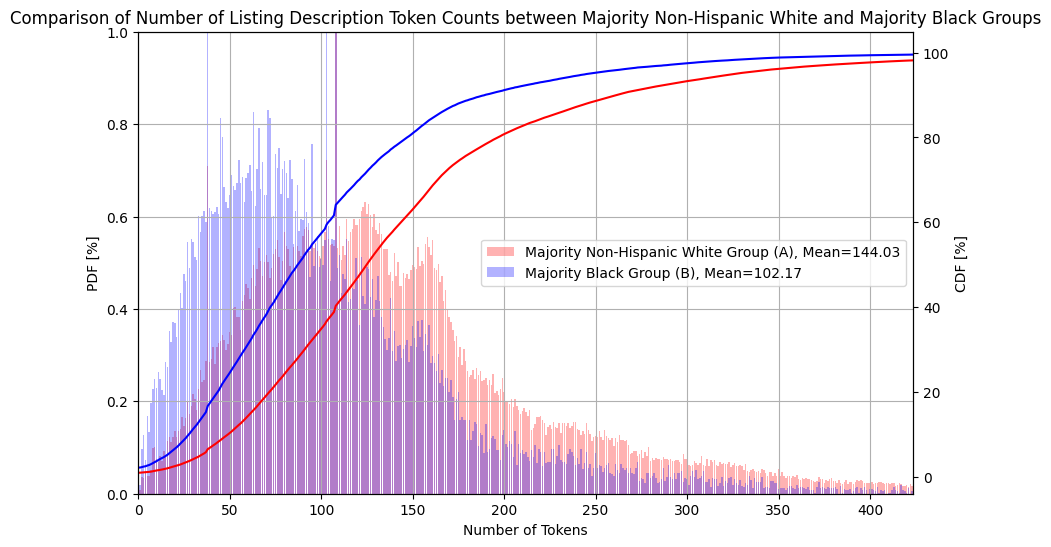 Figure 3. Probability Distribution and Cumulative Distribution Functions of the Number of Tokens in the Group A and Group B of Listing Descriptions
While the difference in the number of tokens is significant, on its own it may not be an indication that the two collections describe different aspects of the homes or that they contain significant semantic differences. Rather, it could be due to a correlation between the number of tokens and the number of distinct features of each listing to be described, which could correlate with the price of the listings — especially when there is already a known existing disparity between housing values across the two demographic groups of interest.
To demonstrate this, the matrix in Figure 4 shows correlations between different pairs of common listing features. From the matrix we can see that the number of tokens (i.e. n_tokens) in the listing description has the strongest positive correlation with the number of photos (i.e. photo_count). The number of photos is then most positively correlated with the number of bathrooms as well as the per-county normalized listing price. Again, referencing the known disparity in the housing prices between Group A and Group B, we can see an intuitive link between the number of tokens in listing description and whether the listings belong to Group A or Group B.
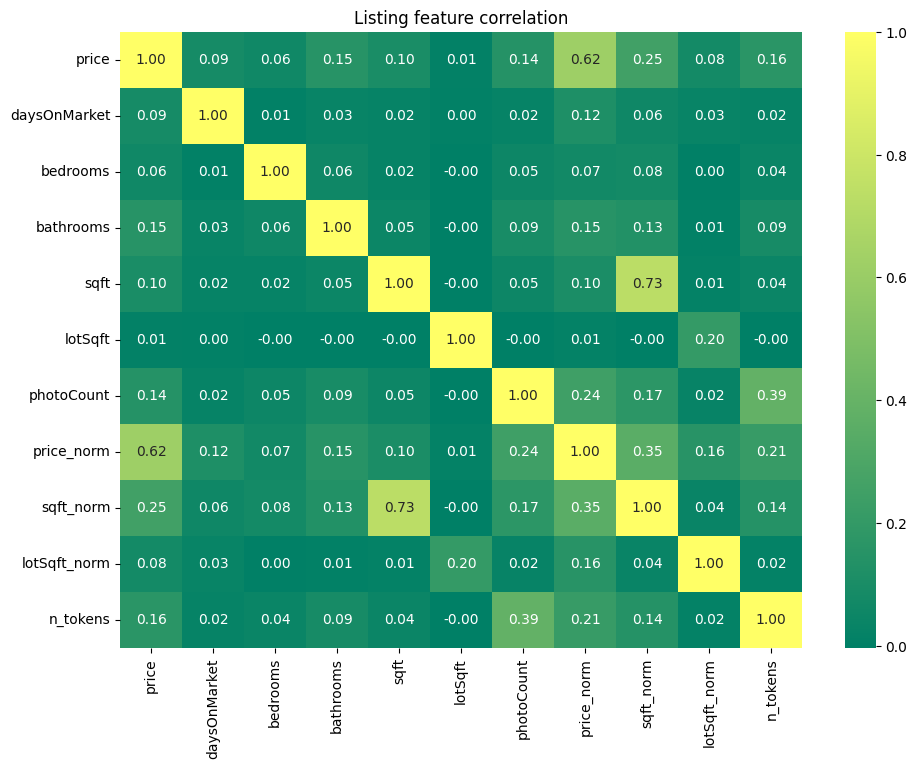 Figure 4. Correlation Matrix Between Various Listing Features, including the number of tokens in the listing description (n_tokens)
Key-Phrase Statistics
Next, we will explore whether there are actual semantic differences between the content of the listing descriptions. For example, what aspects of homes are typically described in listing descriptions from each group?
One way to do this is to compare the distribution of common key phrases between the two groups. A multitude of NLP techniques can be used to extract well-formed and meaningful key phrases. Such techniques include part-of-speech tagging, named entity recognition, or matching terms to a pre-defined ontology of relevant terms and concepts. But since each of these steps might inject its own bias into the process, we want to stay as close to the raw data as possible and use the simplest method available: extracting raw trigrams (i.e., a sequence of 3 consecutive tokens), which we will interchangeably refer to as “phrases” hereafter. To surface which key phrases are more likely to be used in Group A or Group B of listing descriptions, the following method was used:
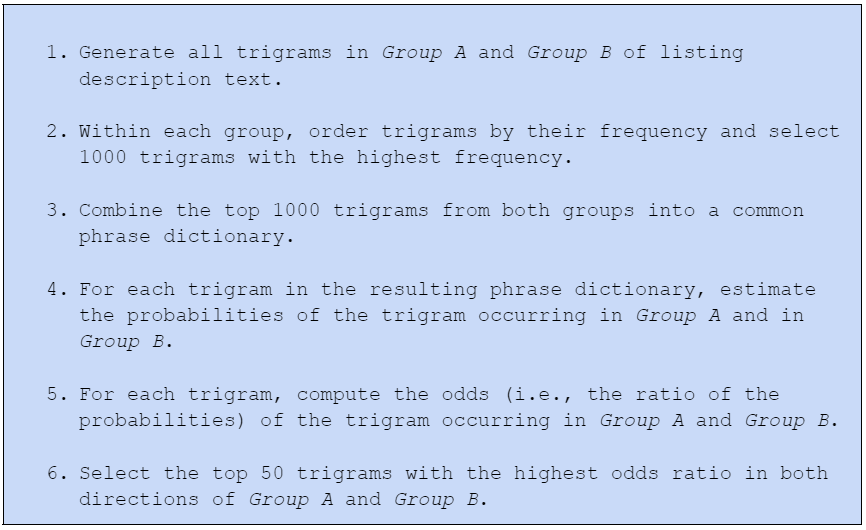
Using the method above we will:
- Consider all the common phrases
- Estimate their probabilities
- Rank them by the odds ratio of each phrase occurring either in Group A or in Group B.
NOTE: In order to estimate the probabilities, we used a Bayesian estimate with informed prior, based on the average probability of phrases in the overall corpus. This helps to smooth out the estimated probabilities and to avoid spurious results when phrases occur either too infrequently or too frequently, simply due to chance.
The results of the above analysis are visualized in Figure 5 (below). From bottom to top we can see the most unique phrases for each corpus (Group A on the left (red) and Group B on the right (blue)). The length of each bar indicates the odds ratio of the phrase occurring in the respective corpus. For example, the top phrase for the majority Black category “to your portfolio“ with value 10.1 indicates that this phrase has 10.1 times higher odds of being found in Group B than in Group A. Similarly, the top phrase in the majority non-Hispanic white category was “pool and spa,” with a value of 24.1, which indicates that it has 24.1 times higher odds of being found in Group A than in Group B.
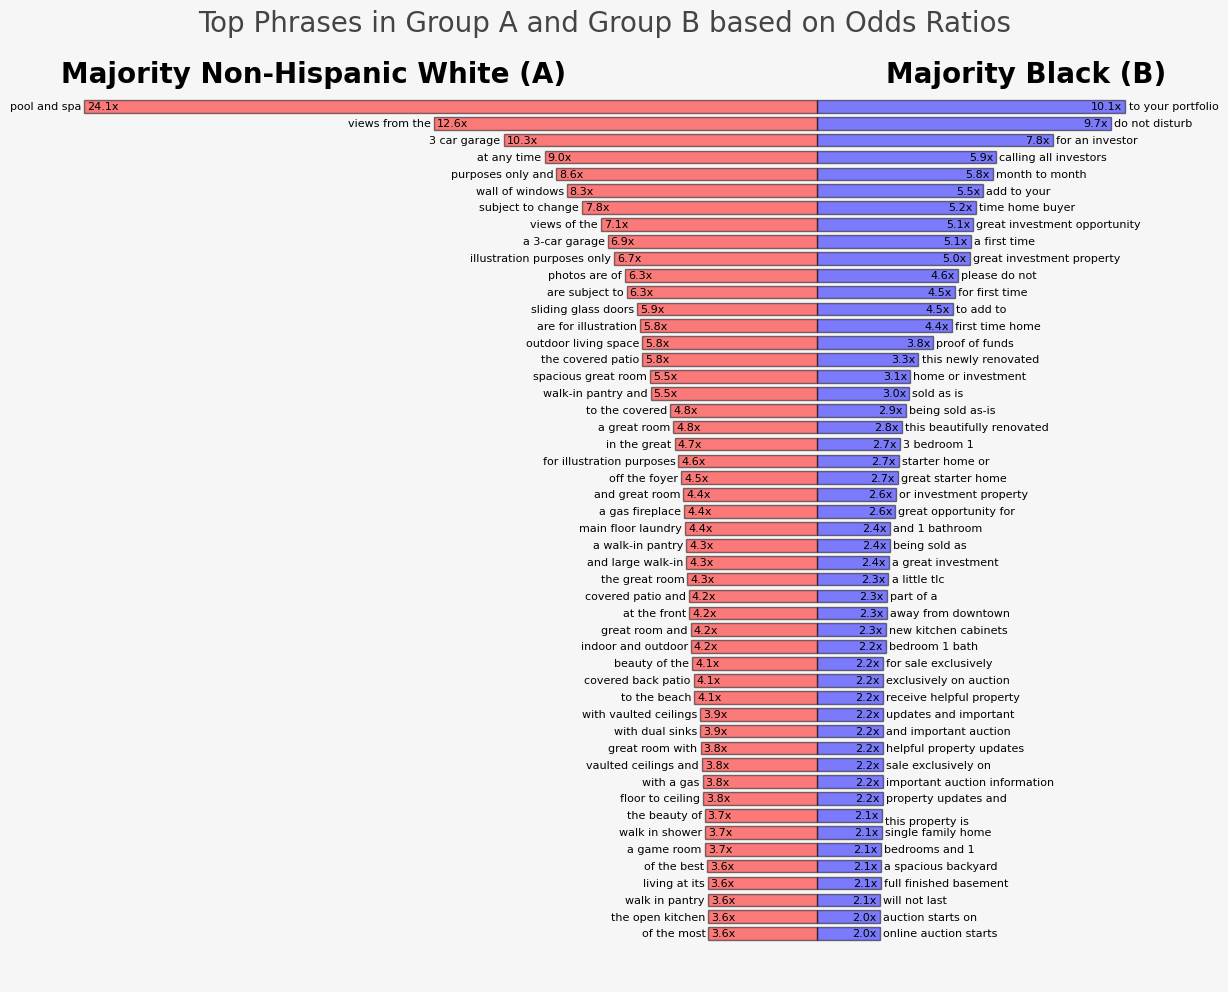 Figure 5. Comparison of Top 50 Most Unique Phrases in Group A and Group B Corpus of Listing Descriptions
By reading both sides of the plot top to bottom we can quickly identify the unique aspects and semantic meaning differences of each collection relative to the other. We can notice that in listings from Group A (i.e., majority non-Hispanic white locations), the most unique phrases focus on:
- Upscale home features (e.g., “pool and spa”, “3 car garage”, “wall of windows”, “with vaulted ceilings” or “with dual sinks”)
- Preferred location (e.g., “views from the”, “in the great” or “to the beach”)
- Superlatives (e.g., “beauty of the“, “of the best“, “of the most“ or “at its finest“)
- Illustration Photos (e.g., “illustration purposes only”, “photos are of”)
On the other hand, the dominant themes among listings from Group B (i.e., majority Black locations) are:
- Investment opportunity (e.g., “to your portfolio“, “for an investor“, “calling all investors“ or “great investment opportunity“, “great investment property”)
- Current tenant (e.g., “do not disturb”, “please do not “)
- First-time home buyer opportunity (e.g., “ time home buyer“, “great starter home“)
- Accepting condition as is (e.g., “sold as is“, “being sold as-is”, “a little tlc“)
- Home Renovations (e.g., “this newly renovated”, “this beautifully renovated”, “new kitchen cabinets”)
- Auctions (e.g., “important auction information“, “exclusively on auction“, “online auction starts“).
A more complex and thorough analysis would be required to establish the specific causal links between the differences in the dominant unique themes for homes in majority non-Hispanic-white and majority Black locations. The insights presented above are merely a correlation between the most unique themes described in listings descriptions in each group and the listings being located in neighborhoods with specific dominant racial demographics. Nevertheless, the distinct and differentiated dominant themes summarized above tell a story of the content of listing descriptions potentially functioning as a proxy for the dominant racial demographic of the location of the homes.
Topic Modeling Analysis
The key phrase-based analysis presented in the previous section provided clear examples that we were able to generalize to dominant themes, which illustrate the most notable differences among listing descriptions in majority non-Hispanic white and majority Black neighborhoods. However, this method had several limitations and challenges. Most notably:
- The extraction of trigrams is too simplistic and multiple phrases are semantically equivalent.
- The interpretation of the results and grouping into semantic themes must be done manually by a human, which increases the effort, makes it difficult to automate and potentially injects subjectivity.
With more complex models we can go even further and automate nearly the entire process. One suitable technique for doing this is a Topic analysis that uses Latent Dirichlet Allocation (LDA). LDA is a generative model that treats documents as a bag of words (or tokens) and learns a hierarchical topical model by assigning each document to a distribution of topics and then assigning a distribution of words to each topic.
Typically, LDA is used to understand the dominant topics in a collection of documents, where topics can be understood based on the assigned words with the highest probability. Below we will explain how LDA can be used to understand the differences between two collections of text. For easier interpretability, we also propose to use an LLM that automatically labels each topic based on its top words. The method we will use can be broken down as follows:
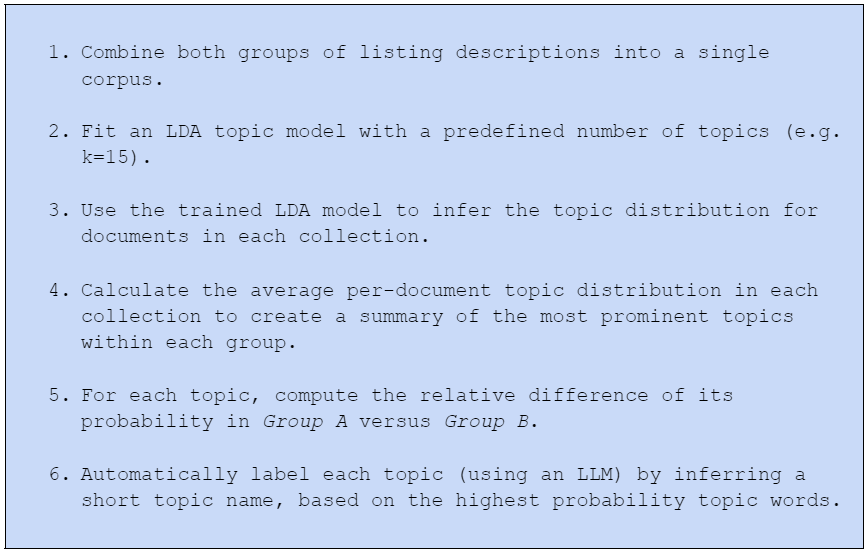
Note that in step 1 of the above method, we do not need to use the entire corpus. We can use a representative sample instead. In this analysis, we fit the LDA topic model to a sample of 10,000 listing descriptions from each group, with the goal of extracting 15 topics. A tool such as pyLDAvis can be used to interactively explore and understand the topic distribution of the entire collection of documents.
For example, Figure 6 (below) shows the topic visualization provided by the pyLDAvis tool, and allows the user to interactively explore the topics and understand which ones are more correlated with each other ( based on the co-location in the Intertopic Distance Map), their prominence (i.e. the size of each topic marker), as well as the word distribution for a particular topic (in the example below, based on the top words, we can interpret topic 5 as being related to convenient location).
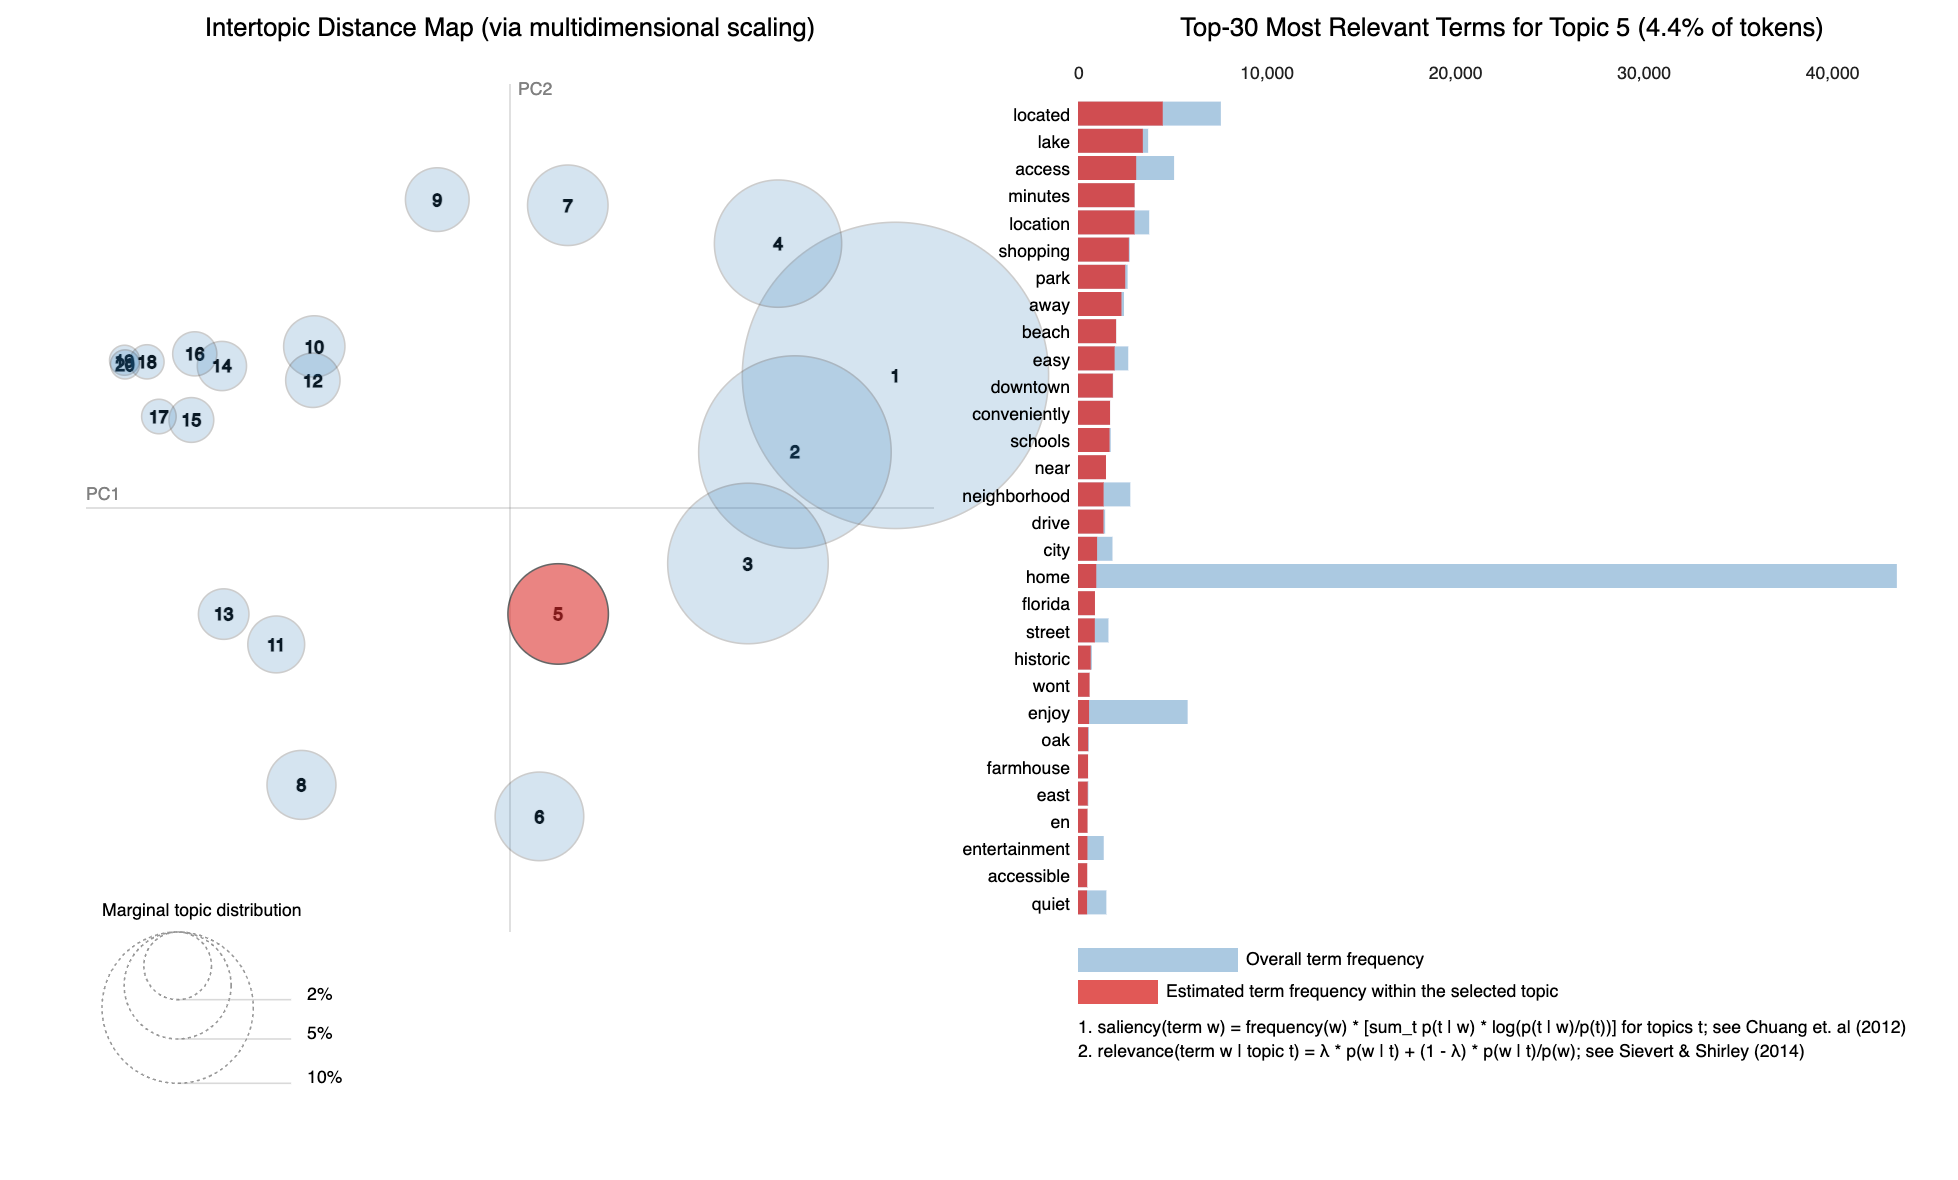 Figure 6. LDA-based Topic Distribution for Combined Corpus of Listing Descriptions, with a focus on Topic #5.
One of the more tedious parts of the topic analysis method using LDA is to come up with the semantic meaning of each topic, based on the top words. To simplify our comprehension of the extracted topics, we can use an LLM to assign each one with a short representative label, based on the top 20 words of said topic. Below is the prompt we used to label the topics.
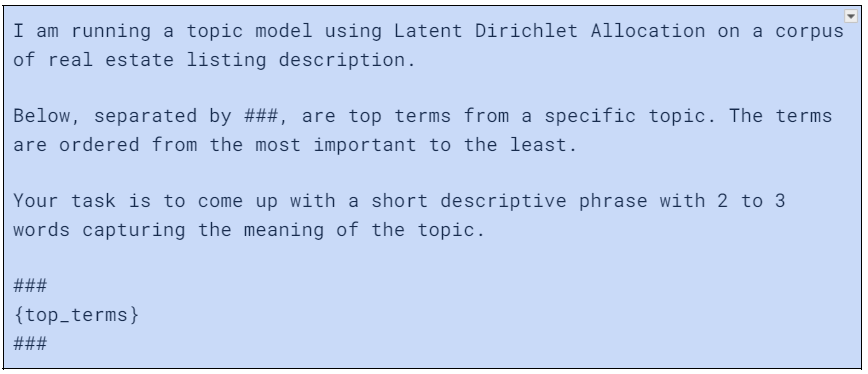 Figure 7 (below) compares the average probability of each topic annotated with its LLM-generated label for both Group A and Group B.
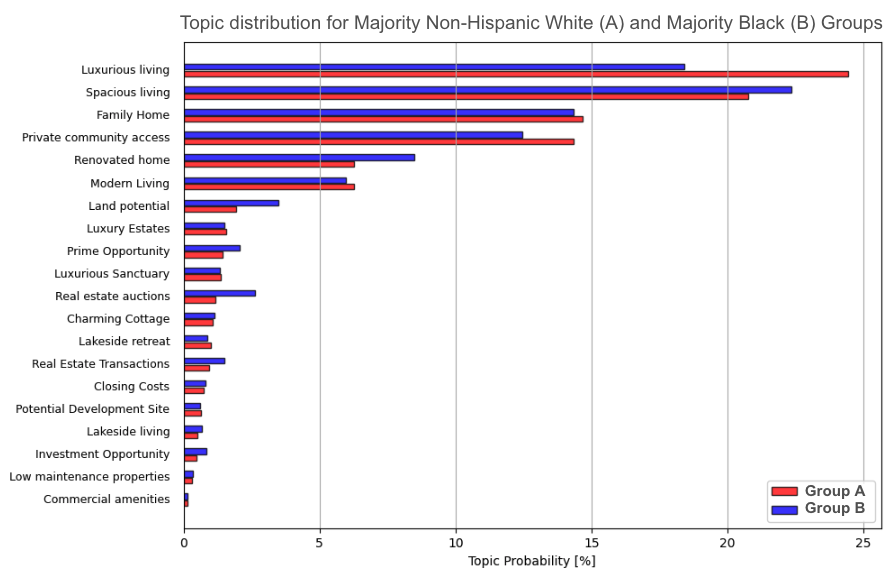 Figure 7. Comparison of per-Group Topic Distribution
To better understand the relative differences, we computed the relative lift in each topic’s representation in Group B, relative to Group A, in order to understand which topics are disproportionately over- or under-represented in the listing descriptions. Figure 8 (below) shows the relative lift, with positive (blue) bars reflecting topics that are more likely represented in Group B and negative (red) bars reflecting topics more likely represented in Group A.
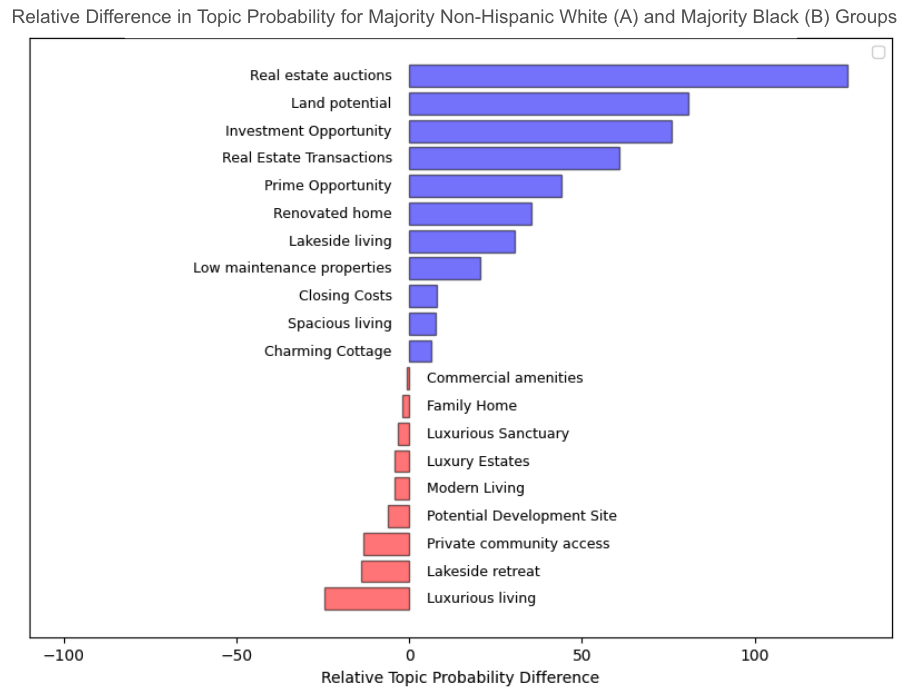 Figure 8. Relative Lift in Topic Probability between Group A (in blue) and Group B (in red)
By reading Figure 8 above, we can reach a very similar conclusion as what we learned from the keyphrase-based analysis:
Listings in majority Group A (i.e., non-Hispanic white) neighborhoods disproportionately more likely relate to:
- Luxury living
- Private community access
while listings in Group B (i.e., majority Black) neighborhoods disproportionately more likely relate to:
- Real estate auctions
- Investment opportunity
- Home renovations
Conclusion
In this blog post, we showcased how AI models can be powerful tools for understanding complex unstructured data at scale, especially textual data. More specifically, we demonstrated how AI can be used to identify notable differences in the content of real-estate listing descriptions for homes located in areas with different dominant racial demographics, belonging either to majority non-Hispanic white or majority Black groups. Starting with simple corpus-based statistics, progressing to comparing the distribution of frequent key phrases, and finally using unsupervised topic modeling we have shown that there are notable differences in lexical features, as well as in the semantics of the listing description text between the two groups.
These learnings, and realities of the real-estate data, are important to consider when building complex AI systems that use listing descriptions as an input. As demonstrated in the blog post, the content of the listing descriptions can function as a proxy for a protected class such as race.
This is not to say that listing descriptions should not be used. Rather, this should serve as a reminder that disparities and correlations with protected classes are omni-present in the real-estate data, and developers of AI systems in real estate should be aware of how these biases can manifest themselves.
Related Articles


Sign up for Zillow news updates
Subscribe to receive daily emails for the latest Zillow news and announcements, product updates and more.
%20--%3e%3cdefs%3e%3cstyle%3e%20.st0%20{%20fill:%20%23111116;%20}%20%3c/style%3e%3c/defs%3e%3cpath%20class='st0'%20d='M.67,84.17v-9.38L39.19,20.75v-1.12H1.34V4.67h62.64v9.38l-37.85,54.04v1.12h38.97v14.96H.67Z'/%3e%3cpath%20class='st0'%20d='M75.04,9.36c0-5.58,4.13-9.71,9.94-9.71s9.94,4.13,9.94,9.71-4.13,9.71-9.94,9.71-9.94-4.02-9.94-9.71ZM76.71,84.17V27h16.53v57.17h-16.53Z'/%3e%3cpath%20class='st0'%20d='M106.3,84.17V1.32h16.53v82.85h-16.53Z'/%3e%3cpath%20class='st0'%20d='M135.33,84.17V1.32h16.53v82.85h-16.53Z'/%3e%3cpath%20class='st0'%20d='M161.79,55.58c0-18.42,12.62-30.37,31.71-30.37s31.71,11.95,31.71,30.37-12.73,30.37-31.71,30.37-31.71-11.95-31.71-30.37ZM208.58,55.58c0-9.49-6.25-16.19-15.07-16.19s-15.18,6.7-15.18,16.19,6.25,16.3,15.18,16.3,15.07-6.81,15.07-16.3Z'/%3e%3cpath%20class='st0'%20d='M246.32,84.17l-17.2-57.17h16.86l11.61,40.64h1.12l10.16-40.64h16.53l10.94,40.98h1.12l11.39-40.98h16.41l-17.31,57.17h-21.55l-8.71-37.85h-1.12l-8.6,37.85h-21.66Z'/%3e%3cpath%20class='st0'%20d='M362.44,84.17V4.67h56.94v15.86h-38.3v17.53h33.5v14.51h-33.5v31.6h-18.65Z'/%3e%3cpath%20class='st0'%20d='M428.76,84.17V27h16.3v7.82h1.23c2.46-5.36,8.04-8.93,14.07-8.93,2.34,0,4.69.56,6.48,1.45v14.85c-3.24-1.45-7.03-2.12-9.38-2.12-7.26,0-12.17,6.03-12.17,14.85v29.25h-16.53Z'/%3e%3cpath%20class='st0'%20d='M471.64,55.58c0-18.42,12.62-30.37,31.71-30.37s31.71,11.95,31.71,30.37-12.73,30.37-31.71,30.37-31.71-11.95-31.71-30.37ZM518.43,55.58c0-9.49-6.25-16.19-15.07-16.19s-15.18,6.7-15.18,16.19,6.25,16.3,15.18,16.3,15.07-6.81,15.07-16.3Z'/%3e%3cpath%20class='st0'%20d='M545.11,84.17V27h16.52v8.04h1.12c4.24-6.48,9.71-9.71,16.64-9.71,12.95,0,21.55,10.05,21.55,23.78v35.06h-16.52v-32.72c0-7.03-4.02-11.95-10.72-11.95s-12.06,5.25-12.06,12.51v32.16h-16.52Z'/%3e%3cpath%20class='st0'%20d='M617.13,65.74v-26.69h-8.04v-12.06h8.49l3.24-18.09h12.95l-.11,18.09h13.06v12.06h-13.06v26.02c0,4.8,2.9,8.04,7.59,8.04,1.56,0,4.02-.33,5.92-.78v11.84c-3.24,1.12-7.93,1.79-11.17,1.79-11.5,0-18.87-8.15-18.87-20.21Z'/%3e%3cpath%20class='st0'%20d='M686.58,84.17V4.67h34.95c19.43,0,31.93,10.27,31.82,26.69,0,16.3-12.62,26.8-31.93,26.8h-16.52v26.02h-18.31ZM704.89,44.08h15.07c9.16,0,14.85-5.02,14.85-12.73s-5.81-12.62-14.85-12.62h-15.07v25.35Z'/%3e%3cpath%20class='st0'%20d='M757.71,55.58c0-18.42,12.62-30.37,31.71-30.37s31.71,11.95,31.71,30.37-12.73,30.37-31.71,30.37-31.71-11.95-31.71-30.37ZM804.49,55.58c0-9.49-6.25-16.19-15.07-16.19s-15.19,6.7-15.19,16.19,6.25,16.3,15.19,16.3,15.07-6.81,15.07-16.3Z'/%3e%3cpath%20class='st0'%20d='M831.17,84.17V27h16.3v7.82h1.23c2.46-5.36,8.04-8.93,14.07-8.93,2.34,0,4.69.56,6.48,1.45v14.85c-3.24-1.45-7.03-2.12-9.38-2.12-7.26,0-12.17,6.03-12.17,14.85v29.25h-16.52Z'/%3e%3cpath%20class='st0'%20d='M874.16,55.58c0-18.2,12.62-30.37,31.04-30.37,15.52,0,27.36,8.71,29.25,22.22l-15.41,2.01c-1.45-6.25-7.26-10.61-13.62-10.61-8.37,0-14.74,6.92-14.74,16.75s6.25,16.75,14.63,16.75c6.59,0,12.17-4.35,13.73-10.5l15.52,1.9c-2.12,13.51-14.07,22.22-29.37,22.22-18.2,0-31.04-12.28-31.04-30.37Z'/%3e%3cpath%20class='st0'%20d='M944.73,84.17V1.32h16.52v33.39h1.12c4.35-6.25,9.71-9.49,16.64-9.49,12.95,0,21.66,10.05,21.66,23.67v35.28h-16.52v-32.83c0-7.03-4.13-11.95-10.83-11.95s-12.06,5.25-12.06,12.62v32.16h-16.52Z'/%3e%3c/svg%3e)
