- Press Releases
Sustainability
Social Impact
Explore how Zillow is driving real progress toward a more affordable and accessible housing market.
- Investors
- Careers
13 min read
How the Zillow Indoor Dataset Facilitates Better 3D tours and Advances the Science of Indoor Spaces

When it comes to buying or renting a home, digital tools are becoming an increasingly popular way for people to identify what they want before they invest the time to physically tour a property.
In Zillow’s 2021 renter’s survey, more than half (58%) of renters agreed at least that 3D tours would help them get a better feel for the space than static photos, up from 55% just six months prior. Half (50%) agreed that they wish more listings had 3D tours available.
Buyers are enthusiastic about new tools as well. In another survey this past February, people were most likely to cite viewing a digital floor plan and a 3D virtual tour (both 79%) as tools they would like to use to help shop for homes.
Following these trends, Zillow’s 3D Home® interactive floor plans are becoming a more popular way to provide home shoppers the means to experience homes without being physically present. Never has this been more important than in recent times, where the ability to explore a home virtually has provided the added benefit of increased safety and security for buyer and seller alike.
The creation of such tools has been the mandate of Zillow’s Rich Media Experiences Team (RMX), whose focus is to provide home shoppers with a more immersive and authentic sense of the home. Production of 3D Home interactive floor plans creates large quantities of accurate data, which in turn are used by RMX to develop new models and methods to automate the creation process to increase efficiency, as well as for research and development of new products and experiences. In order to support similar advances in the academic community, RMX has released this data to the public in the form of the Zillow Indoor Dataset (ZInD).
In this blog post we will describe the preparation process, important attributes, and promising applications of ZInD.
The difference with Zillow’s approach
Unlike competitors that often rely on specialized 3D scanners, Zillow’s floor plans are created purely from image data. From a set of captured 360 panoramas, an interactive tour is created, providing the viewer with the ability to choose their pace, path, and viewpoint as they traverse the home.
The 3D Home interactive floor plan makes use of the position of each panorama and localized pose of each listing photo, and displays the viewer’s current position and viewpoint. It simultaneously provides both local and global context, resulting in an experience that far surpasses traditional real estate imagery.
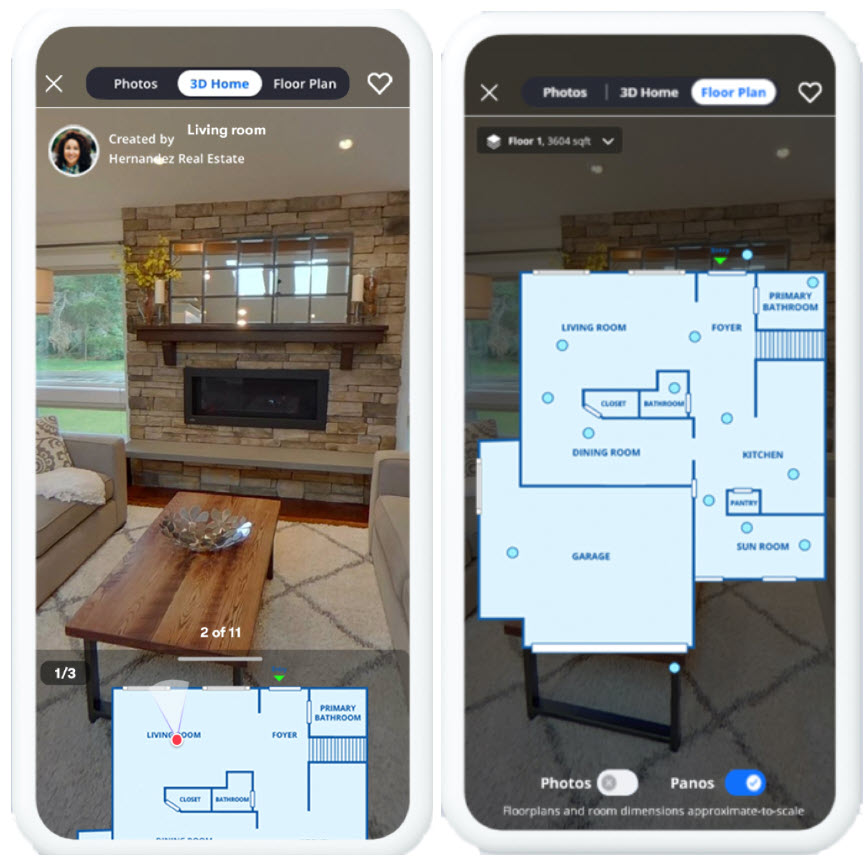 Figure 1. Zillow’s 3DHome Capture App.
The secret and potential of this approach comes from ZInD. Derived from 3D Home interactive floor plan captures (capture app shown above in Figure 1.), ZInD contains 360-degree panoramas from real homes, along with annotated room geometry and 2D and 3D floor plans.
The data contained in ZInD has been used internally for model development and method validation for some time. Now, for the first time, Zillow will be releasing this data to the research community to aid progress in room layout estimation, automated floor plan creation, and other tasks in the domain of indoor understanding. While a forthcoming paper recently accepted to the IEEE/CVF Conference on Computer Vision and Pattern Recognition will go into greater technical detail, we first wish to share the essentials of the dataset, as well as the mission motivating its release.
To better understand ZInD, it is useful to understand the source, our ZInD annotation pipeline.
Our Floor Plan Creation Pipeline
ZInD contains over 70,000 panoramas from over 1,500 unfurnished homes, from which over 2,500 floor plans have been created. To capture this data at scale, Zillow partnered with photographers in 20 U.S. cities coast to coast, providing 360 panoramic images of each room in each floor.
Specific capture guidelines on lighting and the number of panoramas-per-space increase the quality of the derived floor plans. From the perspective of ZInD, increased data uniformity is an important aspect of the data intended for machine learning (ML) model development.
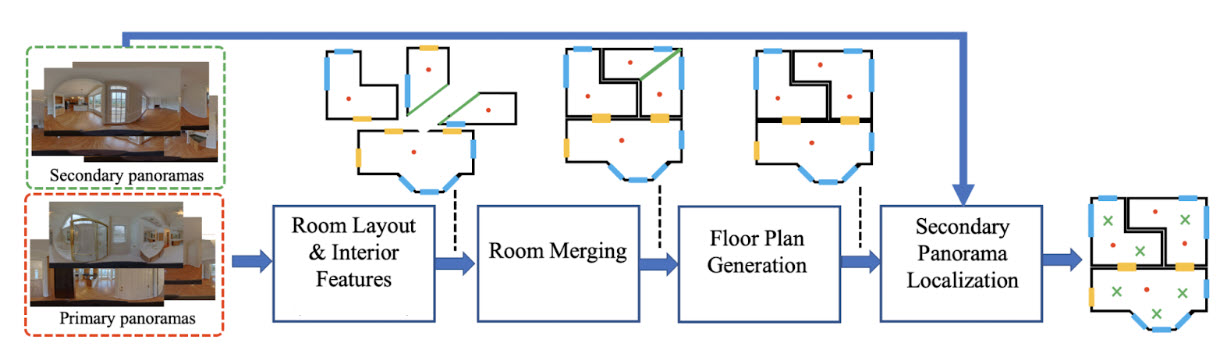
Internally, RMX has developed an extensive pipeline for floor plan creation by an in-house team of annotators assisted by automation. Figure 2 provides a high level overview of our annotation pipeline, while Figure 3 contains visualizations of the content produced at each step of the pipeline - the individual steps will be explained in the following. In total, we estimate the ZInD dataset has taken over 1,500 hours of annotation work. To increase floor plan accuracy and creation efficiency, RMX is increasingly introducing automation to the pipeline through in-house ML model development.
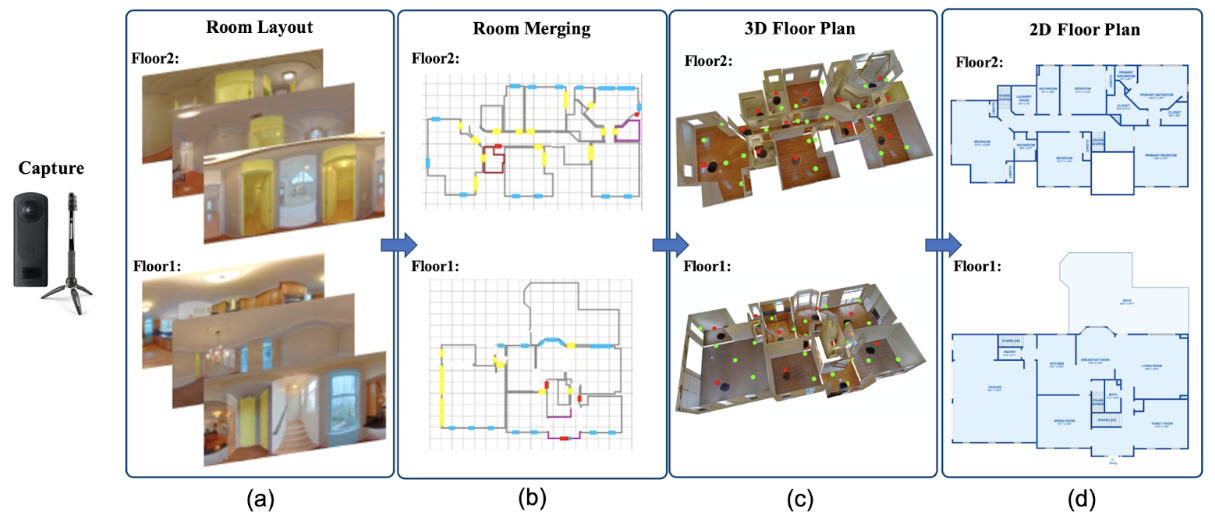 Figure 3. Visualization of content produced at each step of the annotation pipeline. The Zillow Indoor Dataset dataset provides visual data covering real world distribution of unfurnished homes, including primary 360o panoramas with annotated room layouts, windows and doors, merged rooms, secondary localized panoramas, and final 2D floor plans. From left-to-right: (a) captured RGB panoramas with layout, windows and doors annotations, (b) merged layouts, (c) 3D textured mesh, where red dots indicate primary panoramas and green dots indicate annotated secondary panoramas, (d) final 2D floor plan “cleanup” annotation.
Annotation of Room Layout and Interior Features
After an initial image preprocessing step, which straightens each panorama so that the camera is upright, the room layout and interior features must be delineated. From the perspective of each panorama, an ML model estimates the floor-wall and ceiling wall-boundaries, as well as the wall-wall corners. This is commonly referred to as the room shape or layout.
Further, the model jointly estimates the wall-features: the windows, doors, and openings (WDO) of the room. An opening is a convenience of floor plan construction, used to split-up large and/or complex spaces which often prove too difficult to annotate accurately from a single perspective. Our annotation team then verifies the predictions and corrects any errors if necessary. These layouts are completed in 3D, by annotating the basic wall structure as well as the height of a single ceiling plane.
Room Merging
Following this room shape step, the separate rooms are then spatially placed together to complete the floor plan puzzle. This step is also assisted by an algorithm to suggest room-room spatial adjacencies by snapping doors and openings together while minimizing a cost function. A depiction of layout and wall feature annotation, along with room merging assisted by automatic proposals, is contained in Figure 4 below.
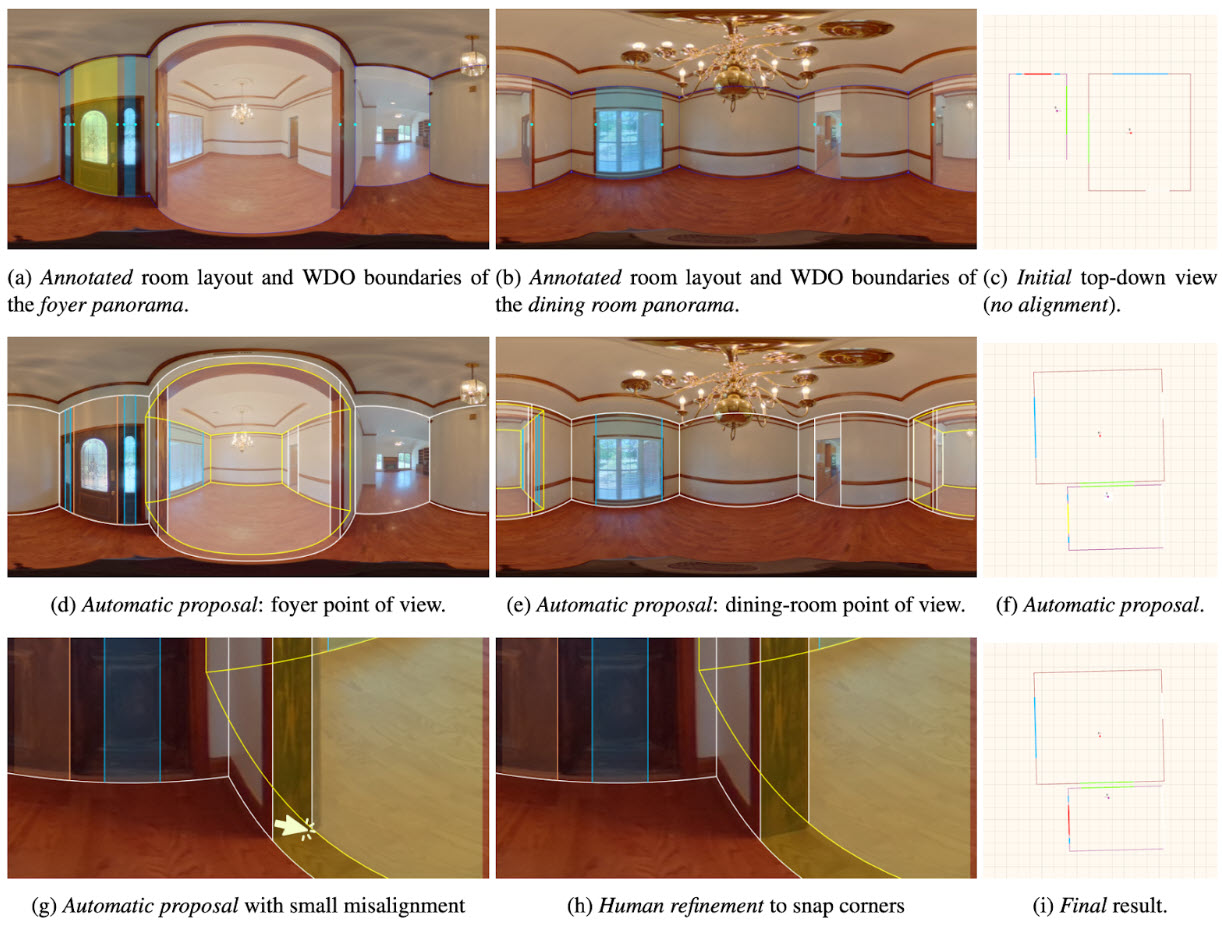 Figure 4. Assisted Room Merging: optimized for high accuracy with high throughput. In the 1st row we show the annotated room layouts and WDO boundaries from the previous stage. In the last column we visualize the top-down layout projection before any proposed alignment. In the 2nd row, we demonstrate the highest-ranked automatic alignment that would be surfaced to our human annotators, when they select to merge those two panoramas. Given the current proposal, the layout of the other panorama is rendered with yellow outlines. Human annotators can further refine the room-to-room alignment, as shown in the 3rd row, by simply dragging the yellow outlines.
Cleanup and Final Floor Plan Generation
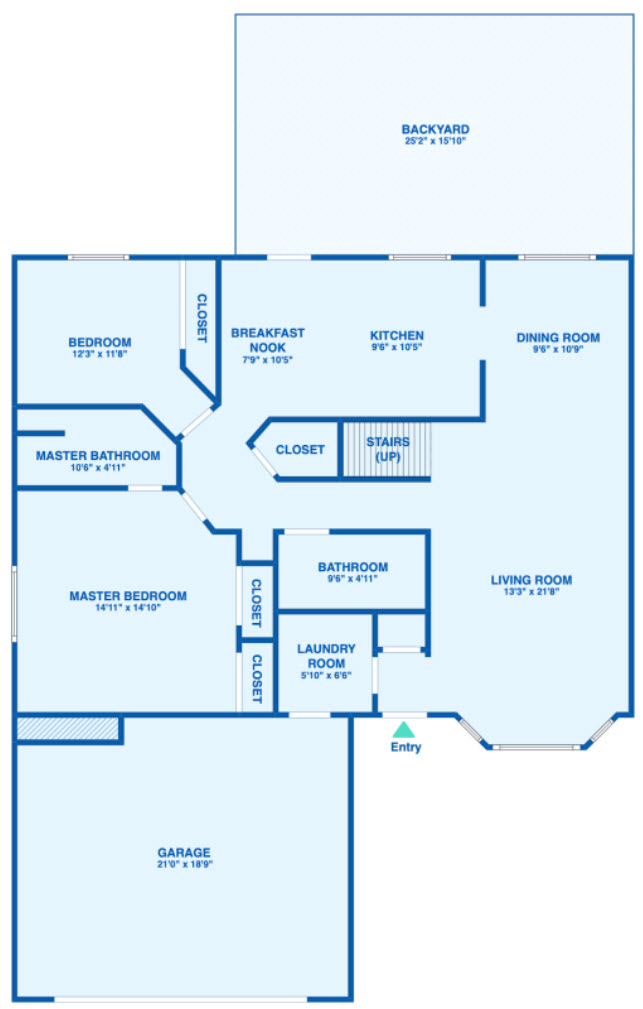
Figure 5. Example Zillow floor plan, as posted to Zillow.com.
To produce the final cleaned-up floor plan published on Zillow.com, annotators then complete the cleanup step. This step improves the quality of the final floor plan through correction of small misalignments between walls, clean up of semantic labels for rooms, and addition of small spaces which may be missing such as closets and stairs. An example floor plan is above in Figure 5.
Layout Completion
The partial room layouts that arise due to usage of openings can be convenient for human annotation and floor plan creation, but may be less-so for model development and general research purposes. As such, we subsequently merge these partial room layouts to produce complete layouts.
This process results in a single unified geometry for an open floor plan. To accomplish this, first a graph of partial room associations across openings is constructed. Partial room layouts are then repeatedly merged by binary addition of the floor segmentations, followed by contour extraction and polygon simplification.
Secondary Panorama Localization
Of all panoramas captured, annotators choose a subset for floor plan creation. These are referred to as the primary panoramas. There are often more panoramas captured than are used to create the floor plan, so to better facilitate different types of research, these additional secondary panoramas are subsequently localized on the created floor plan. This step is also assisted by automation, which suggests an initial pose (i.e., position and orientation) of each panorama and then submits it for subsequent annotator verification.
The combination of complete geometry and secondary panorama localizations produces whole layouts shared by multiple panoramic views. We believe that this increased density of coverage, as well as the increased spatial association between panoramas, will increase the utility of our dataset within the research community. The process of both layout completion and secondary panorama annotation is displayed in Figure 6 below.
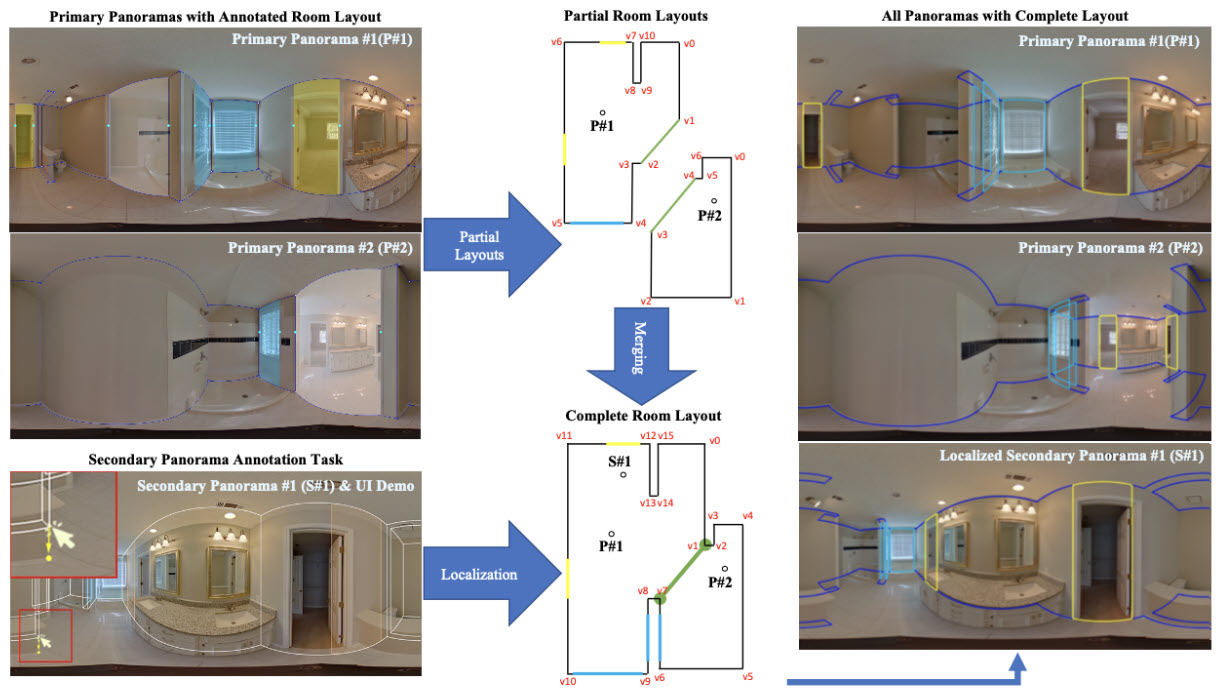 Figure 6. Complete room layout and secondary panorama localization. Top/Center: process of computing complete room layouts of complex spaces, based on merged annotations of partial layouts from each panorama’s point of view. Bottom left: the secondary panorama localization task, where annotators can achieve pixel level accuracy by dragging the corners of an existing 3D layout (inherited from a reference, primary panorama) to snap to 2D image corners. Right: the complete layout from the point of view of all 3 panoramas localized on the same shared layout.
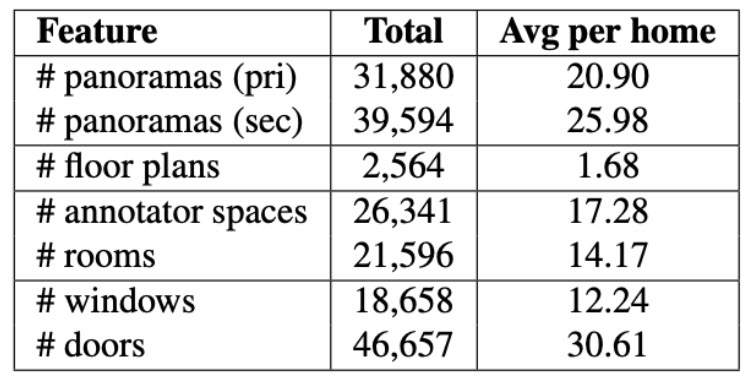 The statistics of primary and secondary panoramas, as well as floor plans, rooms, and wall features.
The capture and floor plan creation process is visualized in Figure 2. A visualization of the data produced for ZInD is in Figure 3. The primary and secondary panoramas are red and green, respectively, in column c.
Final Dataset Post-Processing
To reduce privacy concerns, we have automatically detected and removed any panoramas that contain:
(1) People or photographs of people to avoid sharing PI or PII information.
(2) Significant outdoor view, to avoid sharing street views or neighboring properties.
ZInD: A reflection of the real world distribution of home environments
Many datasets in the domain of indoor understanding capture only a subset of the real distribution of layout geometry, and often a simpler one at that. By providing the merged geometry of entire homes, ZlnD contains tremendous diversity, and serves as a rich platform for research and development.
Commonly, existing datasets focus heavily on simple room layout types, such as cuboids and L-shaped rooms. However, real world homes include much more complex rooms, with bay windows, breakfast nooks, and open floor plans that seamlessly transition from kitchen to dining room and living room.
In the research literature, indoor environments consisting entirely of 90o angles are commonly called “Manhattan,” with cuboids and L-shaped rooms as common examples. In contrast, ZInD goes beyond these more common geometric types, including larger general Manhattan layouts, as well as non-Manhattan layouts such as bay-windowed rooms.
 ZlnD statistics for cuboid vs. Manhattan style rooms.
While typical cuboid and L-shaped layouts are sampled primarily from bedrooms and offices, the whole home environments provide a significant increase in diversity. Below you will find a sample of annotated layouts and wall features for bathrooms, bedrooms, dining rooms, kitchens, living rooms, and garages.
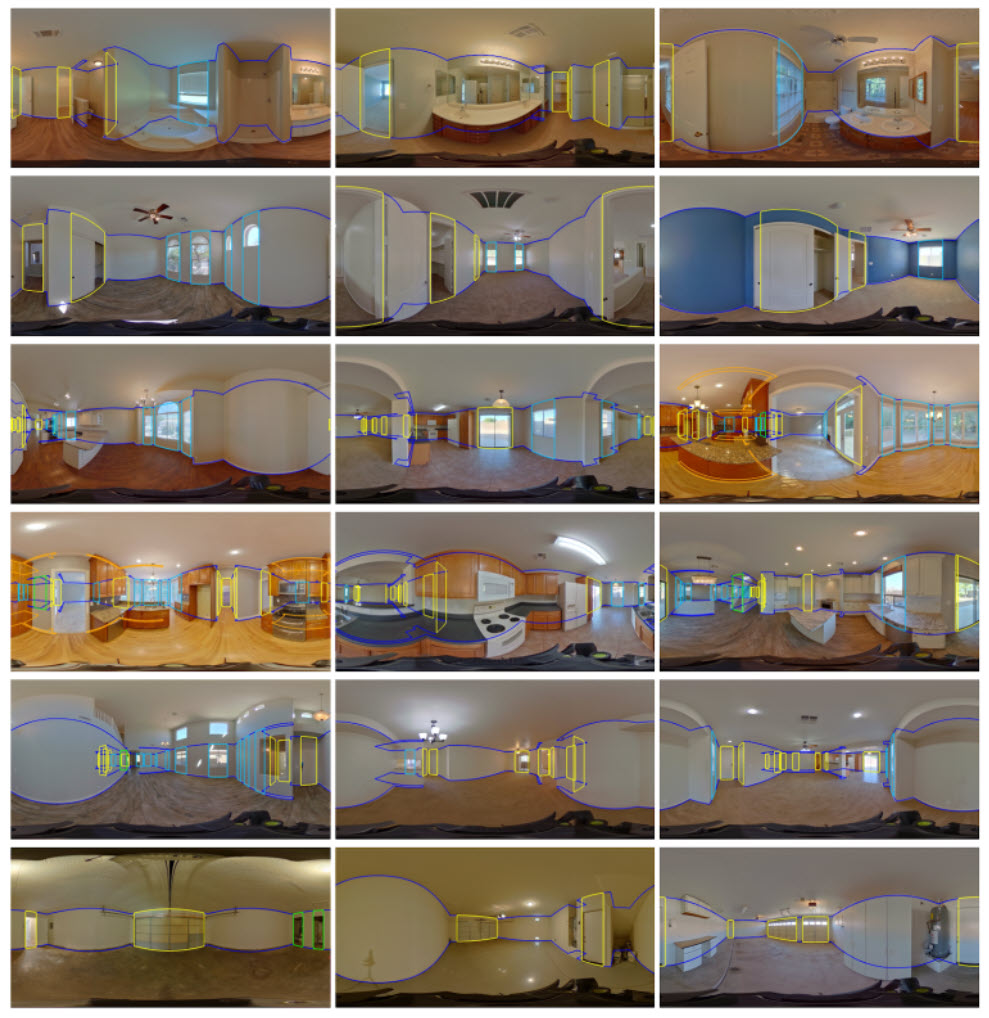 Figure 7. Semantic room type visualizations. Wall layouts, doors, and windows are delineated in dark blue, yellow, and light blue, respectively. Additional interior geometry, such as pillars and intermediate walls, are delineated in orange. Note the significant diversity in ZInD’s annotated geometry and room types.
Promising Applications
An important task in the domain of indoor understanding is automatic room layout estimation. As explained above, RMX leverages an ML model to aid our annotators in this task. Importantly, the competency of an ML-model depends directly on the data on which it was trained. If the model has only seen simple cuboid and L-shaped rooms during training, it may be too much to ask of the model to accurately estimate larger and more complex layouts.
Further, such rooms may prove too difficult to completely estimate from a single panoramic perspective. By providing a diverse spectrum of real-world indoor environments, with increased density of coverage in larger spaces, we believe that ZInD will support research on new methods to accurately estimate these complex spaces.
To demonstrate the utility of ZInD for the layout estimation task, we trained a current state-of-the-art model, HorizonNet , on our data. Below are examples of the predictions of the trained model on simple Manhattan layouts.
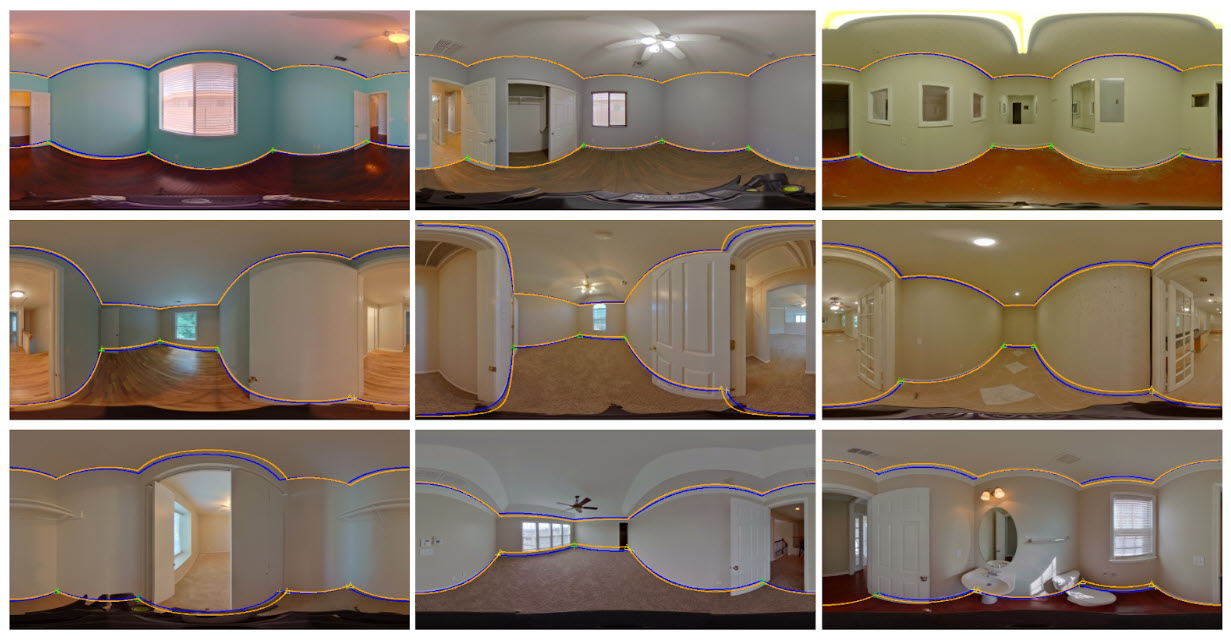 Figure 8. Estimated room layouts for simple Manhattan rooms. The predicted layout is displayed in orange with corners denoted by triangles. The GT layout is in blue with corners denoted by crosses. Corners closer than 1% of the image width are considered accurate, and are highlighted in green.
Predictions on more complex non-Manhattan layouts are shown below. HorizonNet is only capable of estimating Manhattan layouts — as shown, the predictions are unable to capture non-90o angles. This demonstrates the need for further research on accurately estimating such layouts, for which our ZInD provides a useful platform. A recent work on layout estimation for more complex geometry, AtlantaNet , relied on fresh annotations of 100 images in order to explore this space. By comparison, ZInD provides a significantly larger testbed for such research.
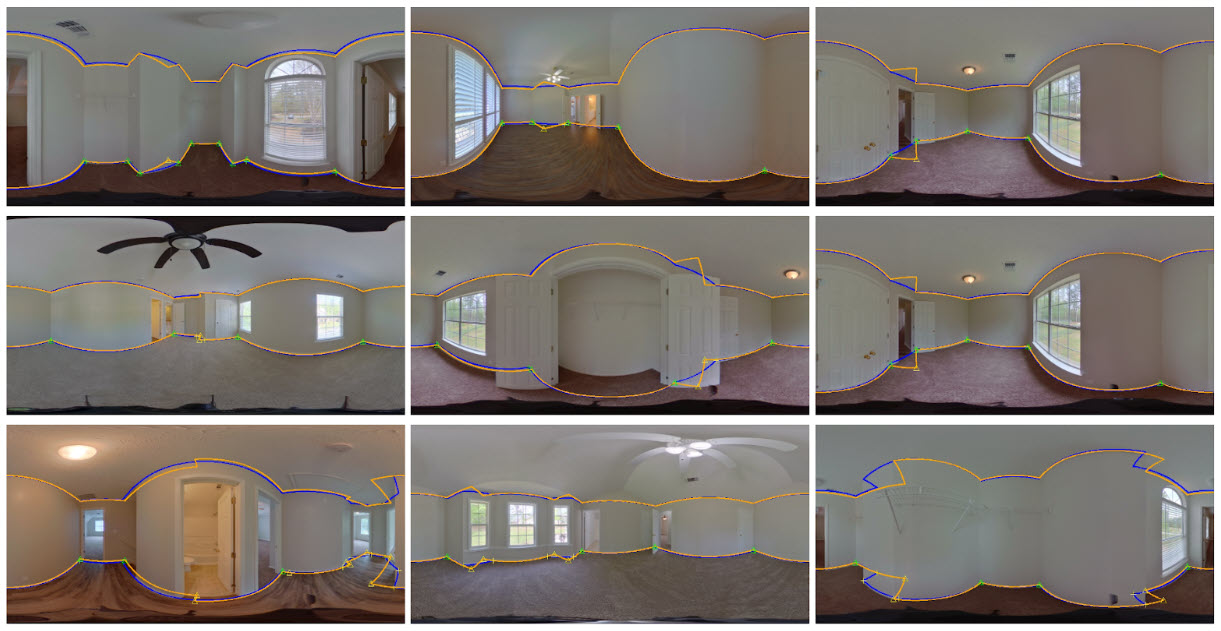 Figure 9. Estimated room layouts for non-Manhattan rooms. The predicted layout is displayed in orange with corners denoted by triangles. The GT layout is in blue with corners denoted by crosses. Corners closer than 1% of the image width are considered accurate, and are highlighted in green.
Conclusion
ZInD has come together as a result of the joint effort of a diverse group of engineers, scientists, and annotators. In addition, we were able to take advantage of another Zillow Group company, Bridge Interactive, to distribute ZInD to the academic community. Bridge’s flexible API and data licensing platform made sharing over 30GB of data much easier and more secure. In particular, we would like to acknowledge the contributions and team effort of our fellow members of the RMX Applied Science team, without which this release and paper submission would not have come together . In providing ZInD to the community, we hope to stimulate innovation in real estate technology, in order to further Zillow’s goal of giving people the power to unlock life’s next chapter.
Citations:
Steve Cruz, Will Hutchcroft, Yuguang Li, Naji Khosravan, Ivaylo Boyadzhiev, and Sing Bing Kang. Zillow Indoor Dataset: Annotated floor plans with 360° panoramas and 3D room layouts. In Proceedings of the IEEE/CVF Conference on Computer Vision and Pattern Recognition (CVPR), 2021
Cheng Sun, Chi-Wei Hsiao, Min Sun, and Hwann-Tzong Chen. Horizonnet: Learning room layout with 1D representation and pano stretch data augmentation. In Proceedings of the IEEE/CVF Conference on Computer Vision and Pattern Recognition (CVPR), 2019
Giovanni Pintore, Marco Agus, and Enrico Gobbetti. AtlantaNet: Inferring the 3D indoor layout from a single 360o image beyond the Manhattan world assumption. In Proceedings of the European Conference on Computer Vision (ECCV), 2020.
Related Articles


Sign up for Zillow news updates
Subscribe to receive daily emails for the latest Zillow news and announcements, product updates, research and more.
%20--%3e%3cdefs%3e%3cstyle%3e%20.st0%20{%20fill:%20%23111116;%20}%20%3c/style%3e%3c/defs%3e%3cpath%20class='st0'%20d='M.67,84.17v-9.38L39.19,20.75v-1.12H1.34V4.67h62.64v9.38l-37.85,54.04v1.12h38.97v14.96H.67Z'/%3e%3cpath%20class='st0'%20d='M75.04,9.36c0-5.58,4.13-9.71,9.94-9.71s9.94,4.13,9.94,9.71-4.13,9.71-9.94,9.71-9.94-4.02-9.94-9.71ZM76.71,84.17V27h16.53v57.17h-16.53Z'/%3e%3cpath%20class='st0'%20d='M106.3,84.17V1.32h16.53v82.85h-16.53Z'/%3e%3cpath%20class='st0'%20d='M135.33,84.17V1.32h16.53v82.85h-16.53Z'/%3e%3cpath%20class='st0'%20d='M161.79,55.58c0-18.42,12.62-30.37,31.71-30.37s31.71,11.95,31.71,30.37-12.73,30.37-31.71,30.37-31.71-11.95-31.71-30.37ZM208.58,55.58c0-9.49-6.25-16.19-15.07-16.19s-15.18,6.7-15.18,16.19,6.25,16.3,15.18,16.3,15.07-6.81,15.07-16.3Z'/%3e%3cpath%20class='st0'%20d='M246.32,84.17l-17.2-57.17h16.86l11.61,40.64h1.12l10.16-40.64h16.53l10.94,40.98h1.12l11.39-40.98h16.41l-17.31,57.17h-21.55l-8.71-37.85h-1.12l-8.6,37.85h-21.66Z'/%3e%3cpath%20class='st0'%20d='M362.44,84.17V4.67h56.94v15.86h-38.3v17.53h33.5v14.51h-33.5v31.6h-18.65Z'/%3e%3cpath%20class='st0'%20d='M428.76,84.17V27h16.3v7.82h1.23c2.46-5.36,8.04-8.93,14.07-8.93,2.34,0,4.69.56,6.48,1.45v14.85c-3.24-1.45-7.03-2.12-9.38-2.12-7.26,0-12.17,6.03-12.17,14.85v29.25h-16.53Z'/%3e%3cpath%20class='st0'%20d='M471.64,55.58c0-18.42,12.62-30.37,31.71-30.37s31.71,11.95,31.71,30.37-12.73,30.37-31.71,30.37-31.71-11.95-31.71-30.37ZM518.43,55.58c0-9.49-6.25-16.19-15.07-16.19s-15.18,6.7-15.18,16.19,6.25,16.3,15.18,16.3,15.07-6.81,15.07-16.3Z'/%3e%3cpath%20class='st0'%20d='M545.11,84.17V27h16.52v8.04h1.12c4.24-6.48,9.71-9.71,16.64-9.71,12.95,0,21.55,10.05,21.55,23.78v35.06h-16.52v-32.72c0-7.03-4.02-11.95-10.72-11.95s-12.06,5.25-12.06,12.51v32.16h-16.52Z'/%3e%3cpath%20class='st0'%20d='M617.13,65.74v-26.69h-8.04v-12.06h8.49l3.24-18.09h12.95l-.11,18.09h13.06v12.06h-13.06v26.02c0,4.8,2.9,8.04,7.59,8.04,1.56,0,4.02-.33,5.92-.78v11.84c-3.24,1.12-7.93,1.79-11.17,1.79-11.5,0-18.87-8.15-18.87-20.21Z'/%3e%3cpath%20class='st0'%20d='M686.58,84.17V4.67h34.95c19.43,0,31.93,10.27,31.82,26.69,0,16.3-12.62,26.8-31.93,26.8h-16.52v26.02h-18.31ZM704.89,44.08h15.07c9.16,0,14.85-5.02,14.85-12.73s-5.81-12.62-14.85-12.62h-15.07v25.35Z'/%3e%3cpath%20class='st0'%20d='M757.71,55.58c0-18.42,12.62-30.37,31.71-30.37s31.71,11.95,31.71,30.37-12.73,30.37-31.71,30.37-31.71-11.95-31.71-30.37ZM804.49,55.58c0-9.49-6.25-16.19-15.07-16.19s-15.19,6.7-15.19,16.19,6.25,16.3,15.19,16.3,15.07-6.81,15.07-16.3Z'/%3e%3cpath%20class='st0'%20d='M831.17,84.17V27h16.3v7.82h1.23c2.46-5.36,8.04-8.93,14.07-8.93,2.34,0,4.69.56,6.48,1.45v14.85c-3.24-1.45-7.03-2.12-9.38-2.12-7.26,0-12.17,6.03-12.17,14.85v29.25h-16.52Z'/%3e%3cpath%20class='st0'%20d='M874.16,55.58c0-18.2,12.62-30.37,31.04-30.37,15.52,0,27.36,8.71,29.25,22.22l-15.41,2.01c-1.45-6.25-7.26-10.61-13.62-10.61-8.37,0-14.74,6.92-14.74,16.75s6.25,16.75,14.63,16.75c6.59,0,12.17-4.35,13.73-10.5l15.52,1.9c-2.12,13.51-14.07,22.22-29.37,22.22-18.2,0-31.04-12.28-31.04-30.37Z'/%3e%3cpath%20class='st0'%20d='M944.73,84.17V1.32h16.52v33.39h1.12c4.35-6.25,9.71-9.49,16.64-9.49,12.95,0,21.66,10.05,21.66,23.67v35.28h-16.52v-32.83c0-7.03-4.13-11.95-10.83-11.95s-12.06,5.25-12.06,12.62v32.16h-16.52Z'/%3e%3c/svg%3e)
