Skip main navigation
Pre-foreclosure
  • Est. $687,000

    10 Lemon Rd, Farmingdale, NJ 07727

    4beds
    2,388sqft
    SingleFamily
    Built in 1972
    1.1 Acres Lot
    $687,000 Zestimate®
    $288/sqft
    $-- HOA

    Overview

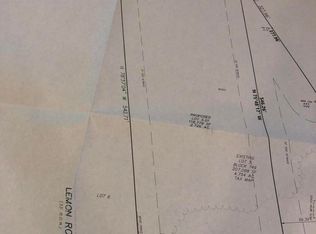
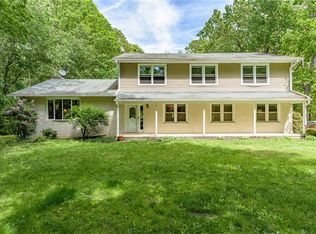
    Spread out on the 1.1 acres of land in this 4 bedroom, 2.5 bath Bilevel home. The upper level is 3 bedrooms, 1.5 baths, Large living room, dining room and eat in kitchen, lower level has 1 bedroom, family room, 2nd kitchen and bath all with a separate entrance. Large garage perfect for a workshop. Private yard with patio, across from the Manasquan Reservoir.
    357 days
    |
    24
    |
    1
    |

      Facts & features

      Interior

      Bedrooms & bathrooms
      • Bedrooms: 4
      • Bathrooms: 3
      • Full bathrooms: 2
      • 1/2 bathrooms: 1
      Heating
      • Electric, Oil
      Cooling
      • Central
      Features
      • Flooring: Carpet
      • Basement: Slab
      Interior area
      • Total interior livable area: 2,388 sqft

      Property

      Parking
      • Total spaces: 3
      • Parking features: Garage - Attached, Garage - Detached
      Features
      • Exterior features: Vinyl
      Lot
      • Size: 1.1 Acres
      Details
      • Parcel number: 2100149000000006
      • Zoning: Residential, Agricultural

      Construction

      Type & style
      • Home type: SingleFamily
      Materials
      • Frame
      • Roof: Composition
      Condition
      • Year built: 1972

      Community & HOA

      Location
      • Region: Farmingdale
      • Municipality: Howell (HOW)

      Financial & listing details

      • Price per square foot: $288/sqft
      • Tax assessed value: $497,400
      • Annual tax amount: $8,511
      • Ownership type: Fee Simple

      Visit our professional directory to find a foreclosure specialist in your area that can help with your home search.

      Find a foreclosure agent

        Foreclosure details

        Estimated market value

        $687,000

        $639,000 - $735,000

        $4,729/mo

        Price history

        DateEventPrice
        3/20/2019Listing removed$375,000$157/sqft
        Source: Keller Williams Realty East Monmouth #21843363 Report a problem
        11/7/2018Listed for sale$375,000+0.1%$157/sqft
        Source: Keller Williams Realty East Monmouth #21843363 Report a problem
        7/18/2018Listing removed$374,500$157/sqft
        Source: C21/ Action Plus Realty #21727849 Report a problem
        6/28/2018Listed for sale$374,500$157/sqft
        Source: C21/ Action Plus Realty #21727849 Report a problem
        5/3/2018Listing removed$374,500$157/sqft
        Source: C21/ Action Plus Realty #21727849 Report a problem
        4/17/2018Price change$374,500-2.7%$157/sqft
        Source: C21/ Action Plus Realty #21727849 Report a problem
        7/17/2017Listed for sale$385,000$161/sqft
        Source: C21/ Action Plus Realty #21727849 Report a problem
        3/28/2017Listing removed$385,000$161/sqft
        Source: GRACE PROPERTIES #479529 Report a problem
        12/28/2016Listed for sale$385,000$161/sqft
        Source: GRACE PROPERTIES #479529 Report a problem
        10/4/2016Listing removed$385,000$161/sqft
        Source: Patrick Parker Realty #21614729 Report a problem
        4/15/2016Listed for sale$385,000-8.3%$161/sqft
        Source: Patrick Parker Realty #21614729 Report a problem
        10/14/2011Listing removed$420,000$176/sqft
        Source: C21/ Action Plus Realty #21114381 Report a problem
        4/15/2011Listed for sale$420,000$176/sqft
        Source: C21/ Action Plus Realty #21114381 Report a problem

        Public tax history

        YearProperty taxesTax assessment
        2025$8,511 +1%$497,400 +1%
        2024$8,423 +2.6%$492,300 +11.7%
        2023$8,208 +7.2%$440,800 +20.8%
        2022$7,654 -6.7%$365,000 +2.2%
        2021$8,200 -4.4%$357,300 +0.7%
        2020$8,579 +5.1%$354,800 -2%
        2019$8,167 $362,000 +5.5%
        2018$8,167 +2.8%$343,000 +3.6%
        2017$7,948 +4.5%$331,100 +5.5%
        2016$7,607 +3.1%$313,800 +1.7%
        2015$7,378 -1%$308,600 +11.1%
        2014$7,453 +0%$277,700
        2013$7,451 -11.2%$277,700
        2012$8,387 +1.7%$277,700 -29%
        2011$8,246 +3.6%$391,200
        2010$7,961 +2.1%$391,200
        2009$7,801 $391,200
        2008-- $391,200
        2007-- $391,200 +172.2%
        2006-- $143,700
        2005-- $143,700
        2003-- $143,700
        2002-- $143,700
        2001-- $143,700

        Find assessor info on the county website

        Monthly payment

        Estimated monthly payment
        All calculations are estimates and provided by Zillow, Inc. for informational purposes only. Actual amounts may vary.
        HOA fees may include property taxes on listings classified as Co-Ops. Contact the listing agent and/or owner for fee details.
        Mortgage interest rates are dependent on a number of factors, including credit score, down payment, and repayment length. Interest rate data provided by Zillow Group Marketplace, Inc. as of 1/1/1970 from various mortgage lenders with which we have lead or other similar arrangements; the Estimated Payment is an average of those rates.
        See how much you could borrow to make a competitive offer.

        Climate risks

        Neighborhood: 07727

        Getting around

        0 / 100
        Car-Dependent
        25 / 100
        Somewhat Bikeable

        Nearby schools

        GreatSchools rating

        Similar homes

        Skip to the end of the carouselSkip to the beginning of the carousel