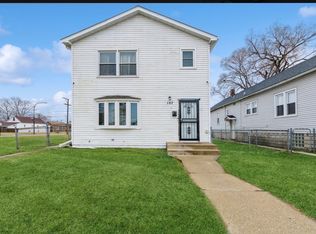
$198,500
3 bd|1 ba|1.5k sqft
102 Michigan City Rd, Calumet City, IL 60409
Off Market
Zillow last checked:
Listing updated:
Patrick Komperda (262)235-5505,
Real Broker, LLC
$138,800
$132,000 - $146,000
$2,613/mo
| Date | Event | Price |
|---|---|---|
| 4/28/2026 | Price change | $143,000-6.5%$78/sqft |
Source: | ||
| 4/2/2026 | Price change | $153,000-7.3%$84/sqft |
Source: | ||
| 3/5/2026 | Price change | $165,000+230%$90/sqft |
Source: | ||
| 12/5/2025 | Pending sale | $50,000$27/sqft |
Source: | ||
| 12/5/2025 | Price change | $50,000-74.4%$27/sqft |
Source: | ||
| 7/31/2025 | Price change | $195,000-4.9%$107/sqft |
Source: | ||
| 7/14/2025 | Price change | $205,000-8.9%$112/sqft |
Source: | ||
| 6/27/2025 | Listed for sale | $225,000$123/sqft |
Source: | ||
| 8/14/2023 | Pending sale | $225,000$123/sqft |
Source: | ||
| 6/17/2023 | Contingent | $225,000$123/sqft |
Source: | ||
| 6/12/2023 | Price change | $225,000+12.5%$123/sqft |
Source: | ||
| 6/10/2023 | Price change | $199,999-19.9%$109/sqft |
Source: | ||
| 4/3/2023 | Price change | $249,700-3.9%$137/sqft |
Source: | ||
| 3/31/2023 | Price change | $259,900+4%$142/sqft |
Source: | ||
| 11/5/2021 | Price change | $250,000+11.1%$137/sqft |
Source: | ||
| 10/29/2021 | Listed for sale | $225,000+55.2%$123/sqft |
Source: | ||
| 9/28/2018 | Sold | $145,000-3.3%$79/sqft |
Source: | ||
| 8/30/2018 | Pending sale | $149,900$82/sqft |
Source: McColly Real Estate #09903685 Report a problem | ||
| 8/6/2018 | Price change | $149,900-6.3%$82/sqft |
Source: McColly Real Estate #09903685 Report a problem | ||
| 4/3/2018 | Listed for sale | $159,900$88/sqft |
Source: McColly Real Estate #09903685 Report a problem | ||
| 1/16/2018 | Listing removed | $159,900$88/sqft |
Source: McColly Real Estate #09697464 Report a problem | ||
| 10/25/2017 | Price change | $159,900-5.9%$88/sqft |
Source: McColly Real Estate #09697464 Report a problem | ||
| 7/21/2017 | Listed for sale | $169,900$93/sqft |
Source: McColly Real Estate #09697464 Report a problem | ||
| Year | Property taxes | Tax assessment |
|---|---|---|
| 2023 | $8,674 +15.6% | $18,999 +37.8% |
| 2022 | $7,502 -2.8% | $13,783 |
| 2021 | $7,722 +4.9% | $13,783 |
| 2020 | $7,358 -31.2% | $13,783 -6.9% |
| 2019 | $10,699 +32.1% | $14,797 |
| 2018 | $8,096 +3.2% | $14,797 |
| 2017 | $7,842 +12.6% | $14,797 +11.6% |
| 2016 | $6,962 +4.8% | $13,263 |
| 2015 | $6,641 -0.4% | $13,263 |
| 2014 | $6,669 +4% | $13,263 -5% |
| 2013 | $6,415 +4.2% | $13,956 |
| 2012 | $6,156 +4.3% | $13,956 |
| 2011 | $5,905 +9.1% | $13,956 -5.5% |
| 2010 | $5,414 +8.7% | $14,773 |
| 2009 | $4,980 +12.5% | $14,773 -5% |
| 2008 | $4,427 +1.4% | $15,551 -4.7% |
| 2007 | $4,365 +8.9% | $16,321 |
| 2006 | $4,010 +8.9% | $16,321 |
| 2005 | $3,683 -2.7% | $16,321 +20% |
| 2004 | $3,786 +2.3% | $13,599 |
| 2003 | $3,699 +7% | $13,599 |
| 2002 | $3,456 +6.9% | $13,599 +5.9% |
| 2001 | $3,233 +3.2% | $12,841 |
| 2000 | $3,134 +1.4% | $12,841 |
| 1999 | $3,091 | $12,841 |
Find assessor info on the county website
Source: MRED as distributed by MLS GRID. This data may not be complete. We recommend contacting the local school district to confirm school assignments for this home.
A local agent can set up tours, give advice and negotiate with sellers.