SELLER WILL PAY ALL CLOSING COSTS AND BUY DOWN THE CURRENT INTEREST RATE AND GIVE MONEY FOR ANY REPAIRS. Single-family residence, 3 bedrooms, 2 bathrooms, approx. 1,920 sq. ft. living area. Built in 1951 on an approx. 10,454 sq. ft. lot, with carport parking. Historical listing records describe central A/C, stucco and wood-frame construction. Property condition, improvements, room sizes and features require current confirmation. All descriptions are provisional and must be approved prior to MLS publication.
For sale
$350,000
10009 Morris Bridge Rd, Tampa, FL 33637
3beds
1,920sqft
Single Family Residence
Built in 1951
-- sqft lot
$-- Zestimate®
$182/sqft
$-- HOA
What's special
Carport parkingStucco and wood-frame construction
- 7 days
- 142
- 5
Likely to sell faster than
Zillow last checked:
Listing updated:
Listed by:
Alvina Nosikovsky 646-220-8533,
Premier Elite Realty Inc.
Source: MIAMI,MLS#: A12113575 Originating MLS: A-Miami Association of REALTORS
Facts & features
Interior
Bedrooms & bathrooms
- Bedrooms: 3
- Bathrooms: 2
- Full bathrooms: 2
Heating
- Central
Cooling
- Ceiling Fan(s), Central Air
Appliances
- Included: Dishwasher
Features
- Other
- Flooring: Carpet, Ceramic Tile
- Windows: Blinds
Interior area
- Total structure area: 2,480
- Total interior livable area: 1,920 sqft
Property
Parking
- Total spaces: 2
- Parking features: Driveway, Other
- Carport spaces: 2
- Has uncovered spaces: Yes
Features
- Stories: 1
- Entry location: First Floor Entry
- Patio & porch: Deck, Screened Porch
- Pool features: R30-No Pool/No Water
- Fencing: Fenced
- View description: None
Lot
- Features: 1/4 To Less Than 1/2 Acre Lot
Details
- Parcel number: U 18 28 20 25B 000000 00013.3
- Zoning: RSC-6/RSC-6 - RES-SF
Construction
Type & style
- Home type: SingleFamily
- Property subtype: Single Family Residence
Materials
- Frame, Stucco
- Roof: Shingle
Condition
- Year built: 1951
Utilities & green energy
- Sewer: Other
- Water: Other
Community & HOA
Community
- Features: None, No Subdiv/Park Info
- Subdivision: North Tampa Land Co's Sub,Northwoods
HOA
- Has HOA: No
Location
- Region: Tampa
Financial & listing details
- Price per square foot: $182/sqft
- Tax assessed value: $314,994
- Annual tax amount: $3,603
- Date on market: 10/28/2026
- Listing terms: All Cash,Conventional,FHA,VA Loan
Estimated market value
Not available
Estimated sales range
Not available
Not available
Price history
| Date | Event | Price |
|---|---|---|
| 10/29/2026 | Listed for sale | $350,000+66.7%$182/sqft |
Source:  MIAMI #A12113575 Report a problem | ||
| 1/27/2018 | Sold | $210,000+5.1%$109/sqft |
Source: Public Record Report a problem | ||
| 10/31/2017 | Price change | $199,900-9.1%$104/sqft |
Source: PINEYWOODS REALTY LLC #T2908234 Report a problem | ||
| 10/23/2017 | Price change | $219,900-4.3%$115/sqft |
Source: PINEYWOODS REALTY LLC #T2908234 Report a problem | ||
| 10/19/2017 | Price change | $229,8000%$120/sqft |
Source: PINEYWOODS REALTY LLC #T2908234 Report a problem | ||
| 10/11/2017 | Listed for sale | $229,900+355.2%$120/sqft |
Source: PINEYWOODS REALTY LLC #T2908234 Report a problem | ||
| 1/18/2017 | Sold | $50,501+320.8%$26/sqft |
Source: Agent Provided Report a problem | ||
| 12/14/2016 | Sold | $12,000-52%$6/sqft |
Source: Public Record Report a problem | ||
| 3/13/2014 | Listing removed | -- |
Source: Auction.com Report a problem | ||
| 12/27/2013 | Price change | $25,000-50%$13/sqft |
Source: Auction.com Report a problem | ||
| 12/25/2013 | Price change | $50,000-29.7%$26/sqft |
Source: Auction.com Report a problem | ||
| 12/8/2013 | Listed for sale | -- |
Source: Auction.com Report a problem | ||
| 3/30/2001 | Sold | $71,100+89.6%$37/sqft |
Source: Public Record Report a problem | ||
| 8/5/1997 | Sold | $37,500$20/sqft |
Source: Public Record Report a problem | ||
Public tax history
| Year | Property taxes | Tax assessment |
|---|---|---|
| 2025 | $3,602 +8.6% | $203,329 +2.9% |
| 2024 | $3,317 +4.2% | $197,599 +3% |
| 2023 | $3,185 +5.8% | $191,844 +3% |
| 2022 | $3,011 +3.2% | $186,256 +3% |
| 2021 | $2,918 +3.1% | $180,831 +1.4% |
| 2020 | $2,830 +2.7% | $178,334 +1.4% |
| 2019 | $2,757 | $175,823 -5.3% |
| 2018 | $2,757 -25.7% | $185,591 +123.5% |
| 2017 | $3,711 +103.7% | $83,025 +8.1% |
| 2016 | $1,822 +6% | $76,784 +7.3% |
| 2015 | $1,719 +11.8% | $71,556 +7.6% |
| 2014 | $1,538 | $66,504 +17.8% |
| 2013 | $1,538 +12.8% | $56,475 +1.8% |
| 2012 | $1,364 -8.3% | $55,455 -9.7% |
| 2011 | $1,487 -11.3% | $61,403 -13.8% |
| 2010 | $1,676 -6.3% | $71,213 -7.3% |
| 2009 | $1,789 +119.2% | $76,794 +25.7% |
| 2008 | $816 -8.8% | $61,108 +3% |
| 2007 | $895 -1.4% | $59,328 +2.5% |
| 2006 | $908 +1.5% | $57,881 +3% |
| 2005 | $894 | $56,195 +3% |
| 2004 | -- | $54,558 +1.9% |
| 2003 | -- | $53,541 -1.7% |
| 2002 | -- | $54,479 +41.9% |
| 2001 | -- | $38,401 +5.2% |
| 2000 | $412 | $36,509 |
Find assessor info on the county website
Monthly payment
Est. payment
Payment breakdown
Explore the cost of this home by adjusting the details. Changes won't be saved.Climate risks
Neighborhood: 33637


Similar homes
- $399,9003 bd3 ba1.4k sqft8906 E LANWAY DRIVE, TAMPA, FL 33637For Sale
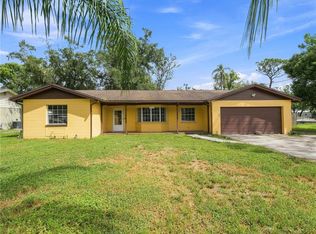
 MLS ID #TB8546030, YAIXY CABRERA, VITA LUXURY REALTY LLC. Stellar MLS
- $350,0003 bd2 ba1.5k sqft9823 SIR FREDERICK STREET, TAMPA, FL 33637For Sale
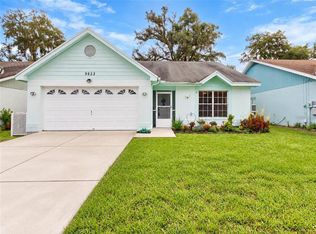 MLS ID #TB8549208, Kinga Sojka, DALTON WADE INC. Stellar MLS
- $322,0003 bd2 ba1.3k sqft7306 PONDEROSA DRIVE, TAMPA, FL 33637For Sale
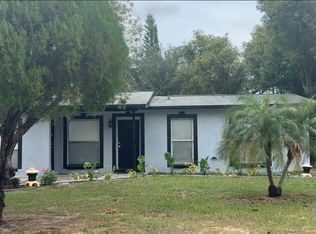 MLS ID #TB8563450, Cassandra Jefferson, ELEVATED REALTY. Stellar MLS
- $525,0003 bd3 ba1.8k sqft9608 WOODLAND RIDGE DRIVE, TEMPLE TERRACE, FL 33637For Sale
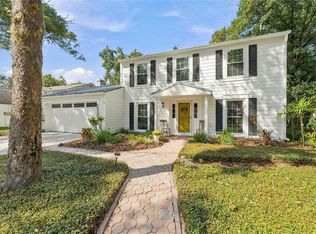 MLS ID #TB8559309, Melissa Williams, COLDWELL BANKER REALTY. Stellar MLS
- $395,0004 bd3 ba2k sqft7939 TERRACE RIDGE DRIVE, TEMPLE TERRACE, FL 33637For SaleMLS ID #TB8559245, Asad Shaikh, LOMBARDO TEAM REAL ESTATE LLC. Stellar MLS
- $324,5003 bd3 ba1.2k sqft8302 CLERMONT STREET, TAMPA, FL 33637For SaleMLS ID #TB8563084, David Kushner, JD ELITE REALTY GROUP INC. Stellar MLS
- $345,0003 bd2 ba1.2k sqft7920 GEORGE WASHINGTON LANE, TAMPA, FL 33637For SaleMLS ID #TB8557076, Ovais Syed, STAR BAY REALTY CORP.. Stellar MLS
- $324,5003 bd2 ba1.2k sqft8301 IBERIA PLACE, TAMPA, FL 33637For SaleMLS ID #TB8485878, David Kushner, JD ELITE REALTY GROUP INC. Stellar MLS
- $339,9003 bd2 ba1.4k sqft8304 NATCHEZ STREET, TAMPA, FL 33637For SaleMLS ID #O6419188, Robert Salmons, ENTERA REALTY LLC. Stellar MLS
- $299,0003 bd2 ba1.4k sqft8609 CHINABERRY DRIVE, TAMPA, FL 33637For SaleMLS ID #TB8555959, Michael Ding, XD REALTY LLC. Stellar MLS
- $324,9003 bd2 ba1.4k sqft7603 SAVANNAH LANE, TAMPA, FL 33637For SaleMLS ID #O6408675, Robert Salmons, ENTERA REALTY LLC. Stellar MLS
- $367,8383 bd2 ba1.7k sqft416 BROXBURN AVENUE, TEMPLE TERRACE, FL 33617For SaleMLS ID #TB8547337, Juan Castro Jr PA, COLDWELL BANKER REALTY. Stellar MLS
- $350,0004 bd2 ba1.6k sqft9244 FREEDOM HILL DRIVE, SEFFNER, FL 33584For SaleMLS ID #TB8558663, Andrew Duncan, LPT REALTY LLC. Stellar MLS
- $330,0003 bd3 ba1.9k sqft7508 WAKULLA DRIVE, TEMPLE TERRACE, FL 33637For SaleMLS ID #TB8531326, Diana Viloria, ABALARIS. Stellar MLS
- $365,0003 bd3 ba1.3k sqft7504 GADSDEN DRIVE, TAMPA, FL 33637For SaleMLS ID #TB8541433, Md Awal, CHARLES RUTENBERG REALTY INC. Stellar MLS
- $384,0003 bd3 ba1.7k sqft9241 ROCK HARBOUR WAY, TAMPA, FL 33637For SaleMLS ID #O6428560, Yogi Patel, POLO REALTY LLC. Stellar MLS
- $335,0003 bd3 ba1.5k sqft7608 WILLOW PARK DRIVE, TEMPLE TERRACE, FL 33637For SaleMLS ID #TB8499715, Brian McBride, MCBRIDE KELLY & ASSOCIATES. Stellar MLS
- $337,0004 bd3 ba1.3k sqft7018 LYNWOOD DRIVE, TAMPA, FL 33637For SaleMLS ID #O6432860, Karen Albright, OPENDOOR BROKERAGE LLC. Stellar MLS
- $199,9003 bd2 ba1.5k sqft9117 WOOD TERRACE DRIVE, TAMPA, FL 33637For SaleMLS ID #TB8562479, Dale Hunter, GUARDIAN REAL ESTATE SERVICES. Stellar MLS
- $285,0003 bd2 ba1.2k sqft7606 LEON AVENUE, TEMPLE TERRACE, FL 33637For SaleMLS ID #O6453012, Karen Albright, OPENDOOR BROKERAGE LLC. Stellar MLS
