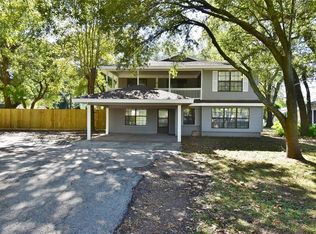
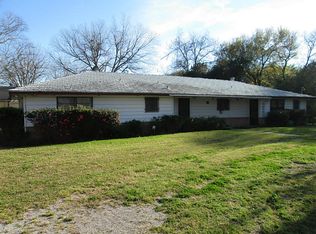
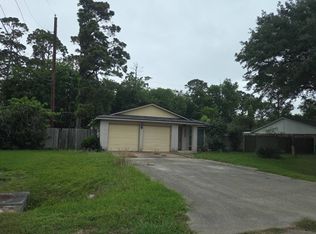
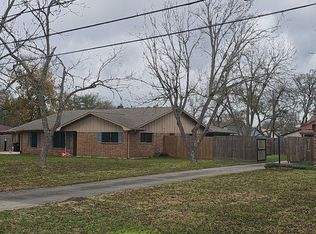
Perfectly set on a tree-shaded lot, feels like home the minute you pull up. The long driveway and spacious grounds located on 1.3 acres offer many possibilitiesAdorable and updated this home is warm and inviting, centered by an open family room w/ custom built-ins, spacious kitchen with eat-in breakfast, plenty of storage space, 3 bedrooms and 1.5 baths.With all the amenities of living in the city but offer a quiet serene piece of TEXAS land!! Dont miss the 46x24 Metal shop with a covered porch area and slab for your RV or boat storageUpdates include: interior/exterior paint, flooring, interior doors, fixtures, and moreThis home is unique in design and offers a place to gather and entertainView today!!
Foreclosed
Street View
Est. $301,600
1003 Bob Smith Rd, Baytown, TX 77521
3beds
1,504sqft
SingleFamily
Built in 1950
1.31 Acres Lot
$301,600 Zestimate®
$201/sqft
$-- HOA
Overview
- 67 days |
- 27 |
- 0 |
Facts & features
Interior
Bedrooms & bathrooms
- Bedrooms: 3
- Bathrooms: 2
- Full bathrooms: 1
- 1/2 bathrooms: 1
Heating
- Other
Cooling
- Central
Appliances
- Included: Dryer, Washer
Interior area
- Total interior livable area: 1,504 sqft
Property
Parking
- Parking features: Carport, Garage - Detached
Features
- Exterior features: Cement / Concrete
Lot
- Size: 1.31 Acres
Details
- Parcel number: 0450130020395
Construction
Type & style
- Home type: SingleFamily
Materials
- Frame
- Foundation: Crawl/Raised
Condition
- Year built: 1950
Community & HOA
Location
- Region: Baytown
Financial & listing details
- Price per square foot: $201/sqft
- Tax assessed value: $300,168
- Annual tax amount: $1,436
Visit our professional directory to find a foreclosure specialist in your area that can help with your home search.
Find a foreclosure agentForeclosure details
Estimated market value
$301,600
$287,000 - $317,000
$1,796/mo
Price history
| Date | Event | Price |
|---|---|---|
| 4/20/2026 | Sold | -- |
Source: Public Record Report a problem | ||
| 12/4/2025 | Price change | $315,000-3.1%$209/sqft |
Source: | ||
| 11/14/2025 | Listed for sale | $325,000+12.8%$216/sqft |
Source: | ||
| 10/26/2024 | Listing removed | $1,300$1/sqft |
Source: | ||
| 10/17/2024 | Listed for rent | $1,300$1/sqft |
Source: | ||
| 10/17/2024 | Listing removed | $288,000$191/sqft |
Source: | ||
| 10/17/2024 | Price change | $288,000-3.7%$191/sqft |
Source: | ||
| 9/10/2024 | Listed for sale | $299,000-16.9%$199/sqft |
Source: | ||
| 7/5/2024 | Listing removed | -- |
Source: Owner Report a problem | ||
| 6/4/2024 | Listed for sale | $360,000+38.5%$239/sqft |
Source: Owner Report a problem | ||
| 3/26/2022 | Listing removed | -- |
Source: | ||
| 2/17/2022 | Pending sale | $259,900$173/sqft |
Source: | ||
| 2/11/2022 | Listed for sale | $259,900$173/sqft |
Source: | ||
Public tax history
| Year | Property taxes | Tax assessment |
|---|---|---|
| 2025 | $1,436 +13.7% | $300,168 +12.7% |
| 2024 | $1,264 +0.1% | $266,253 +12.9% |
| 2023 | $1,262 +41.4% | $235,893 +41.5% |
| 2022 | $893 | $166,733 +14.7% |
| 2021 | -- | $145,358 +9.8% |
| 2020 | -- | $132,362 +2% |
| 2019 | -- | $129,811 +2.5% |
| 2018 | -- | $126,684 |
| 2017 | -- | $126,684 +1.7% |
| 2016 | $98 -25.3% | $124,625 +118% |
| 2015 | $131 | $57,176 +4.7% |
| 2014 | $131 | $54,620 |
| 2013 | -- | $54,620 |
| 2012 | -- | $54,620 -5.8% |
| 2011 | -- | $57,980 -2.8% |
| 2010 | -- | $59,664 -4.9% |
| 2009 | -- | $62,734 |
| 2008 | -- | $62,734 |
| 2007 | -- | $62,734 +10% |
| 2006 | -- | $57,029 |
| 2005 | -- | $57,029 -17.1% |
| 2004 | -- | $68,800 +12.8% |
| 2003 | -- | $61,000 |
| 2002 | -- | $61,000 +37.1% |
| 2001 | -- | $44,500 +11% |
| 2000 | -- | $40,100 |
Find assessor info on the county website
Monthly payment
Estimated monthly payment$1,822
All calculations are estimates and provided by Zillow, Inc. for informational purposes only. Actual amounts may vary.
HOA fees may include property taxes on listings classified as Co-Ops. Contact the listing agent and/or owner for fee details.
Mortgage interest rates are dependent on a number of factors, including credit score, down payment, and repayment length. Interest rate data provided by Zillow Group Marketplace, Inc. as of 1/1/1970 from various mortgage lenders with which we have lead or other similar arrangements; the Estimated Payment is an average of those rates.
See how much you could borrow to make a competitive offer.
Climate risks
Neighborhood: 77521
Nearby schools
GreatSchools rating
- 5/10James Bowie Elementary SchoolGrades: PK-5Distance: 0.8 mi
- 4/10Cedar Bayou Junior High SchoolGrades: 6-8Distance: 1 mi
- 4/10Sterling High SchoolGrades: 9-12Distance: 1.6 mi


- Texas
- Harris County
- Baytown
- 77521
- 1003 Bob Smith Rd
Nearby cities
Nearby neighborhoods
Nearby zip codes
Other Baytown Topics
