$355,000
5 bd|2 ba|2.5k sqft
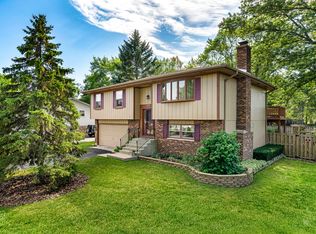
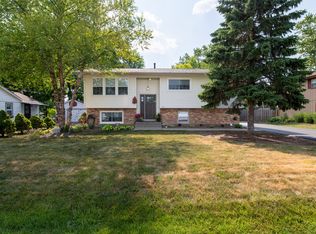
103 Oakleaf Rd, Algonquin, IL 60156
Sold
Zillow last checked: 7 hours ago
Listing updated: 17 hours ago
Heather Rasek 708-227-4707,
RE/MAX Suburban
Not available
Estimated sales range
Not available
Not available
| Date | Event | Price |
|---|---|---|
| 4/9/2026 | Listed for sale | $249,000-0.4%$285/sqft |
Source: | ||
| 4/1/2026 | Listing removed | $249,900$286/sqft |
Source: | ||
| 3/31/2026 | Listed for sale | $249,900$286/sqft |
Source: | ||
| 3/28/2026 | Contingent | $249,900$286/sqft |
Source: | ||
| 3/20/2026 | Listed for sale | $249,900$286/sqft |
Source: | ||
| 3/18/2026 | Contingent | $249,900$286/sqft |
Source: | ||
| 2/19/2026 | Listed for sale | $249,900+4.1%$286/sqft |
Source: | ||
| 1/8/2026 | Listing removed | $240,000$274/sqft |
Source: | ||
| 12/18/2025 | Price change | $240,000-2%$274/sqft |
Source: | ||
| 11/20/2025 | Price change | $244,900-2%$280/sqft |
Source: | ||
| 10/16/2025 | Listed for sale | $249,900-2%$286/sqft |
Source: | ||
| 10/16/2025 | Listing removed | $254,900$291/sqft |
Source: | ||
| 9/25/2025 | Price change | $254,900-1.9%$291/sqft |
Source: | ||
| 9/18/2025 | Listed for sale | $259,900+62.5%$297/sqft |
Source: | ||
| 6/21/2018 | Listing removed | $159,900$183/sqft |
Source: Baird & Warner #09957049 Report a problem | ||
| 6/12/2018 | Price change | $159,900-3%$183/sqft |
Source: Baird & Warner #09957049 Report a problem | ||
| 5/31/2018 | Price change | $164,900-2.9%$188/sqft |
Source: Baird & Warner #09957049 Report a problem | ||
| 5/20/2018 | Listed for sale | $169,900+86.7%$194/sqft |
Source: Baird & Warner #09957049 Report a problem | ||
| 6/7/1999 | Sold | $91,000$104/sqft |
Source: Public Record Report a problem | ||
| Year | Property taxes | Tax assessment |
|---|---|---|
| 2024 | $3,352 +1.7% | $52,320 +11.8% |
| 2023 | $3,297 +2.7% | $46,793 +9.7% |
| 2022 | $3,211 +4.8% | $42,653 +7.3% |
| 2021 | $3,064 +3% | $39,736 +3.7% |
| 2020 | $2,976 | $38,330 +4.5% |
| 2019 | -- | $36,686 +33.3% |
| 2018 | $2,114 +3.3% | $27,526 +6.2% |
| 2017 | $2,047 +3% | $25,931 +6.6% |
| 2016 | $1,987 | $24,321 -21.7% |
| 2013 | $1,987 | $31,078 -14.7% |
| 2011 | -- | $36,429 -6.4% |
| 2010 | -- | $38,933 -9.4% |
| 2009 | -- | $42,953 |
| 2008 | -- | $42,953 +8.2% |
| 2006 | -- | $39,688 +4.9% |
| 2005 | $2,710 +12% | $37,842 +7% |
| 2004 | $2,419 +5.1% | $35,379 +7.5% |
| 2003 | $2,301 +3.9% | $32,926 +7% |
| 2002 | $2,214 +2.3% | $30,772 +5.7% |
| 2001 | $2,164 +5.2% | $29,101 +3.7% |
| 2000 | $2,058 | $28,063 |
Find assessor info on the county website
Source: MRED as distributed by MLS GRID. This data may not be complete. We recommend contacting the local school district to confirm school assignments for this home.