Contingent
$220,000
101 Pheasant Run Rd, Joliet, IL 60433
3beds
1,200sqft
Single Family Residence
Built in 1968
7,920 Square Feet Lot
$-- Zestimate®
$183/sqft
$-- HOA
What's special
Listing description withheld by the listing agent.
- 25 days
- 1,199
- 54
Likely to sell faster than
Zillow last checked:
Listing updated:
Listed by:
Tangela Jones 815-919-8068,
Mosaic Realty LLC
Source: MRED as distributed by MLS GRID,MLS#: 12776491
Facts & features
Interior
Bedrooms & bathrooms
- Bedrooms: 3
- Bathrooms: 3
- Full bathrooms: 2
- 1/2 bathrooms: 1
Rooms
- Room types: No additional rooms
Primary bedroom
- Features: Bathroom (Full)
- Level: Main
- Area: 196 Square Feet
- Dimensions: 14X14
Bedroom 2
- Level: Main
- Area: 144 Square Feet
- Dimensions: 12X12
Bedroom 3
- Level: Main
- Area: 120 Square Feet
- Dimensions: 12X10
Laundry
- Level: Basement
- Area: 48 Square Feet
- Dimensions: 6X8
Heating
- Has Heating (Unspecified Type)
Cooling
- Central Air
Features
- Basement: Finished,Partial
Interior area
- Total structure area: 0
- Total interior livable area: 1,200 sqft
Property
Parking
- Total spaces: 2
- Parking features: Yes, Attached, Garage
- Attached garage spaces: 2
Accessibility
- Accessibility features: No Disability Access
Features
- Stories: 1
Lot
- Size: 7,920 Square Feet
- Dimensions: 66x120
Details
- Parcel number: 3007271150080000
- Special conditions: None
Construction
Type & style
- Home type: SingleFamily
- Property subtype: Single Family Residence
Materials
- Aluminum Siding, Brick
Condition
- New construction: No
- Year built: 1968
Utilities & green energy
- Sewer: Public Sewer
- Water: Public
Community & HOA
HOA
- Services included: None
Location
- Region: Joliet
Financial & listing details
- Price per square foot: $183/sqft
- Tax assessed value: $122,469
- Annual tax amount: $1,963
- Date on market: 10/4/2026
- Ownership: Fee Simple
Estimated market value
Not available
Estimated sales range
Not available
Not available
Price history
| Date | Event | Price |
|---|---|---|
| 7/25/2026 | Listing removed | $210,000$175/sqft |
Source:  MRED as distributed by MLS GRID #12714545 Report a problem | ||
| 7/24/2026 | Listed for sale | $210,000$175/sqft |
Source: MRED as distributed by MLS GRID #12714545 Report a problem | ||
Public tax history
| Year | Property taxes | Tax assessment |
|---|---|---|
| 2024 | $1,963 +16.8% | $40,823 +12.5% |
| 2023 | $1,681 -8.5% | $36,271 +10.6% |
| 2022 | $1,836 +11.4% | $32,809 +7.1% |
| 2021 | $1,649 +9.2% | $30,643 +5.3% |
| 2020 | $1,511 +13.3% | $29,101 +7.6% |
| 2019 | $1,334 +10.6% | $27,045 +8.2% |
| 2018 | $1,206 +18% | $24,991 +10% |
| 2017 | $1,023 +14.6% | $22,721 +8.7% |
| 2016 | $892 +15.1% | $20,904 +6.7% |
| 2015 | $775 | $19,600 +0.5% |
| 2014 | $775 -5.8% | $19,500 -5.3% |
| 2013 | $823 -26.1% | $20,583 -13.7% |
| 2012 | $1,114 -21.6% | $23,859 -18% |
| 2011 | $1,421 -17.6% | $29,100 -12.5% |
| 2010 | $1,724 -2.9% | $33,267 -8.1% |
| 2009 | $1,775 -3.2% | $36,208 |
| 2008 | $1,833 | $36,208 +7% |
| 2007 | -- | $33,840 +10.6% |
| 2006 | $1,805 +1.1% | $30,600 +2.4% |
| 2005 | $1,786 +2.4% | $29,887 +3.1% |
| 2004 | $1,745 +0.4% | $28,977 +4.1% |
| 2003 | $1,737 +3.6% | $27,844 +3.2% |
| 2002 | $1,677 +10.8% | $26,971 +4% |
| 2001 | $1,514 +7% | $25,938 +2% |
| 2000 | $1,415 | $25,429 |
Find assessor info on the county website
Monthly payment
Est. payment
Payment breakdown
Explore the cost of this home by adjusting the details. Changes won't be saved.Climate risks
Neighborhood: Preston Heights
Nearby schools


Similar homes
- $224,9002 bd1 ba700 sqft506 Scribner St, Joliet, IL 60432New
 MLS ID #12796992, Jayson Iniguez, Casa Moderna Real Estate. MRED as distributed by MLS GRID
- $197,5003 bd2 ba1.4k sqft916 Audrey Ave, Joliet, IL 60436Active
 MLS ID #12780467, Chris Czarnowski, Earned Run Real Estate Group. MRED as distributed by MLS GRID
- $165,0003 bd1 ba1.1k sqft621 Elmwood Ave, Joliet, IL 60433Active
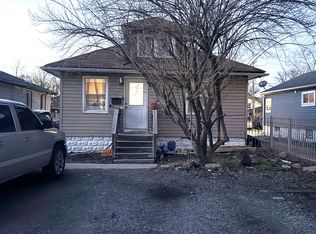 MLS ID #12791450, Keri Hir, Keri Hir. MRED as distributed by MLS GRID
- $230,0003 bd1 ba836 sqft1124 N Hickory St, Joliet, IL 60435Active
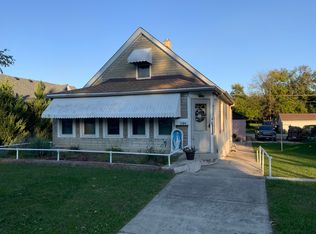 MLS ID #12788393, Becky Dickinson, Charles Rutenberg Realty of IL. MRED as distributed by MLS GRID
