$180,000
5 bd|2 ba|2.1k sqft
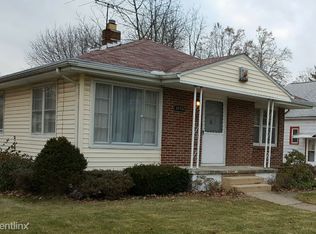
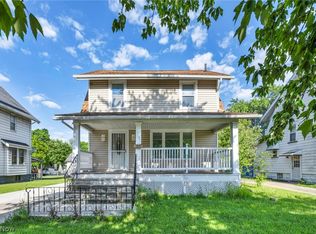
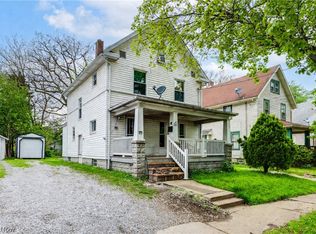
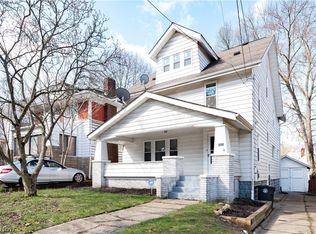
1022 N Howard St, Akron, OH 44310
Sold
Zillow last checked:
Listing updated:
Denise Capriola 330-760-5403 denisecapriola@gmail.com,
Key Realty
Not available
Estimated sales range
Not available
Not available
| Date | Event | Price |
|---|---|---|
| 5/10/2026 | Listed for sale | $159,900+15.9%$100/sqft |
Source: | ||
| 6/23/2025 | Sold | $138,000-7.9%$87/sqft |
Source: | ||
| 5/7/2025 | Pending sale | $149,900$94/sqft |
Source: | ||
| 5/1/2025 | Price change | $149,900-3.2%$94/sqft |
Source: | ||
| 4/22/2025 | Price change | $154,900-3.1%$97/sqft |
Source: | ||
| 3/29/2025 | Price change | $159,900+3.2%$100/sqft |
Source: | ||
| 3/16/2025 | Listed for sale | $154,950+192.4%$97/sqft |
Source: Owner Report a problem | ||
| 5/16/2024 | Sold | $53,000+17.8%$33/sqft |
Source: | ||
| 4/17/2024 | Pending sale | $45,000$28/sqft |
Source: | ||
| 3/8/2024 | Listed for sale | $45,000-3%$28/sqft |
Source: | ||
| 9/29/2022 | Sold | $46,400-45.4%$29/sqft |
Source: Public Record Report a problem | ||
| 6/8/2022 | Listing removed | -- |
Source: | ||
| 5/25/2022 | Price change | $85,000-32%$53/sqft |
Source: | ||
| 5/6/2022 | Price change | $125,000+4.2%$79/sqft |
Source: | ||
| 4/22/2022 | Price change | $120,000-4%$75/sqft |
Source: | ||
| 4/18/2022 | Listed for sale | $125,000-16.6%$79/sqft |
Source: | ||
| 12/29/2021 | Listing removed | -- |
Source: | ||
| 6/28/2021 | Listed for sale | $149,900+1663.5%$94/sqft |
Source: | ||
| 10/27/2017 | Sold | $8,500-97.8%$5/sqft |
Source: Public Record Report a problem | ||
| 8/21/2017 | Listed for sale | -- |
Source: Auction.com Report a problem | ||
| 8/1/2017 | Sold | $380,000+533.3%$239/sqft |
Source: Public Record Report a problem | ||
| 10/31/2000 | Sold | $60,000$38/sqft |
Source: Public Record Report a problem | ||
| Year | Property taxes | Tax assessment |
|---|---|---|
| 2024 | $3,883 +15.4% | $37,690 |
| 2023 | $3,366 -35.3% | $37,690 +70% |
| 2022 | $5,206 +183.5% | $22,173 |
| 2021 | $1,836 | $22,173 |
| 2020 | -- | $22,173 +1.7% |
| 2019 | $5,379 +181.4% | $21,802 0% |
| 2018 | $1,911 -41.8% | $21,810 |
| 2017 | $3,282 | $21,810 |
| 2016 | $3,282 | $21,810 |
| 2015 | $3,282 +58.1% | $21,810 |
| 2014 | $2,076 +15.9% | $21,810 |
| 2013 | $1,791 +2% | $21,810 |
| 2012 | $1,756 +27.3% | $21,810 +0% |
| 2011 | $1,379 +2.6% | $21,802 -4.9% |
| 2010 | $1,344 | $22,932 |
| 2009 | -- | $22,932 |
| 2008 | $1,547 +4.7% | $22,932 -0.6% |
| 2007 | $1,478 +1% | $23,069 |
| 2006 | $1,462 +21% | $23,069 |
| 2005 | $1,209 | $23,069 +12.9% |
| 2004 | -- | $20,437 |
| 2003 | $1,092 -0.6% | $20,437 |
| 2002 | $1,099 +13.2% | $20,437 +27.5% |
| 2001 | $971 +13.7% | $16,031 -0.3% |
| 2000 | $853 | $16,087 |
Find assessor info on the county website
Source: MLS Now. This data may not be complete. We recommend contacting the local school district to confirm school assignments for this home.
A local agent can set up tours, give advice and negotiate with sellers.
A local lender can help you make sure your offer is ready when you are.