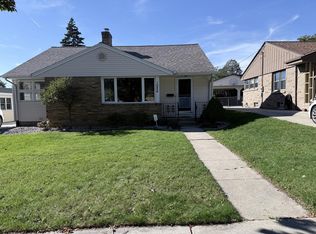
Excellent investment opportunity! This three-unit property features two 3-bedroom units and one 2-bedroom unit. Units 2 and 3 recently remodeled; Unit 2 vacant and ready to rent or owner-occupy. Current rental income of $2,335/month from two occupied units, with projected rents of $3,570/month ($42,840/year) at full occupancy. Rentometer area market averages total $4,489/month based on bedroom counts. Tenants pay gas and electric. Basement offers coin-operated laundry (2 washers, 2 dryers) and tenant storage. Major updates include all three furnaces (2025-26), three landlord-owned refrigerators (2026), two stoves (2024-26), roof (2019), water heaters (2018-20), and exterior grading (2025). Great opportunity for investors or owner-occupants!
Active
$299,000
1027 Albert STREET, Racine, WI 53404
--beds
--baths
--sqft
Multi Family
Built in 1890
-- sqft lot
$286,300 Zestimate®
$--/sqft
$-- HOA
What's special
Tenant storage
- 73 days
- 162
- 18
Zillow last checked:
Listing updated:
Listed by:
Natalie Masse 847-366-3950,
Movoto, Inc.
Source: WIREX MLS,MLS#: 1975799 Originating MLS: Metro MLS
Facts & features
Interior
Heating
- Natural Gas
Appliances
- Included: Dryer, Washer, Seller Owned: Water Heater
Features
- Basement: Full,Laundry Facilities
- Has fireplace: No
Property
Parking
- Parking features: No Garage, Inside Parking, Outside
Lot
- Size: 3,049 Square Feet
Details
- Parcel number: 02147000
- Zoning: R3
Construction
Type & style
- Home type: MultiFamily
- Architectural style: Other
- Property subtype: Multi Family
Materials
- Aluminum/Steel, Aluminum Siding
Condition
- 21+ Years
- New construction: No
- Year built: 1890
Utilities & green energy
- Sewer: Public Sewer
- Water: Public
Community & HOA
Location
- Region: Racine
- Municipality: Racine
Financial & listing details
- Tax assessed value: $196,600
- Annual tax amount: $4,655
- Date on market: 8/12/2026
- Inclusions: 3 Ovens And Refrigerators . 2 Coin Operated Washers And Dryers
- Exclusions: Tenants Personal Property
Estimated market value
$286,300
$272,000 - $301,000
$1,566/mo
Price history
| Date | Event | Price |
|---|---|---|
| 8/12/2026 | Listed for sale | $299,000+30% |
Source:  WIREX MLS #1975799 Report a problem | ||
| 8/1/2024 | Sold | $230,000+2.2% |
Source: WIREX MLS #1882004 Report a problem | ||
| 7/8/2024 | Pending sale | $225,000 |
Source: WIREX MLS #1882004 Report a problem | ||
| 7/2/2024 | Listed for sale | $225,000+18.5% |
Source: WIREX MLS #1882004 Report a problem | ||
| 12/15/2023 | Listing removed | -- |
Source: WIREX MLS #1847647 Report a problem | ||
| 11/12/2023 | Price change | $189,900-4.6% |
Source: WIREX MLS #1847647 Report a problem | ||
| 8/23/2023 | Listed for sale | $199,000+36.3% |
Source: WIREX MLS #1847647 Report a problem | ||
| 11/4/2005 | Sold | $146,000 |
Source: Public Record Report a problem | ||
Public tax history
| Year | Property taxes | Tax assessment |
|---|---|---|
| 2025 | $5,282 +9.9% | $196,600 +10.5% |
| 2024 | $4,806 +5.1% | $177,900 +10.5% |
| 2023 | $4,571 +10.1% | $161,000 +10.3% |
| 2022 | $4,152 -2.3% | $146,000 +9.8% |
| 2021 | $4,250 +9.4% | $133,000 |
| 2020 | $3,886 -25.4% | $133,000 +3.9% |
| 2019 | $5,210 +7.9% | $128,000 +8.5% |
| 2018 | $4,828 +23.5% | $118,000 |
| 2017 | $3,908 -29.9% | $118,000 +5.4% |
| 2016 | $5,575 | $112,000 |
| 2015 | $5,575 | $112,000 |
| 2014 | $5,575 | $112,000 -5.1% |
| 2013 | $5,575 +5.4% | $118,000 -7.8% |
| 2012 | $5,288 +15.7% | $128,000 -8.6% |
| 2011 | $4,570 -7.7% | $140,000 -4.1% |
| 2010 | $4,950 -1.4% | $146,000 |
| 2009 | $5,022 +46% | $146,000 |
| 2008 | $3,439 -29.7% | $146,000 |
| 2007 | $4,892 +30.6% | $146,000 +5% |
| 2006 | $3,747 +60.5% | $139,000 +40.4% |
| 2005 | $2,334 -0.6% | $99,000 +5.3% |
| 2004 | $2,348 +67.9% | $94,000 +88% |
| 2003 | $1,399 +13.1% | $50,000 |
| 2002 | $1,236 -0.3% | $50,000 +6.4% |
| 2001 | $1,240 +2.2% | $47,000 +4.4% |
| 2000 | $1,213 | $45,000 |
Find assessor info on the county website
Monthly payment
Est. payment
Payment breakdown
Explore the cost of this home by adjusting the details. Changes won't be saved.Climate risks
Neighborhood: Douglas Avenue


Similar homes
- $300,000-- bd-- ba-- sqft1220 N Wisconsin STREET, Racine, WI 53402Active
 MLS ID #1967441, Reliance Real Estate Team*. WIREX MLS
- $240,0005 bd2 ba1.4k sqft2415 Prospect STREET, Racine, WI 53404Active
 MLS ID #1967272, Leovigildo Villa. WIREX MLS
- $245,000-- bd-- ba-- sqft927 Marquette STREET, Racine, WI 53404Active
 MLS ID #1955936, Tiffany Harding. WIREX MLS
- $324,9003 bd1 ba1.3k sqft1024 Illinois STREET, Racine, WI 53405Active
 MLS ID #1985474, Leticia Nunez. WIREX MLS
