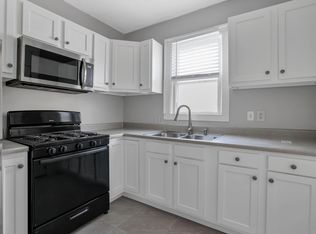
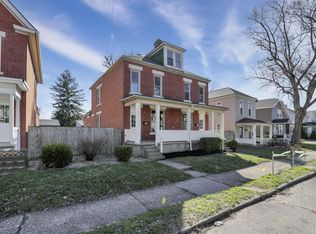
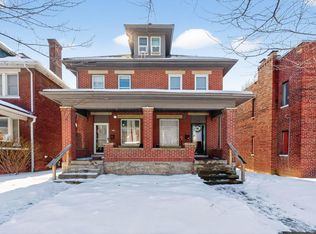
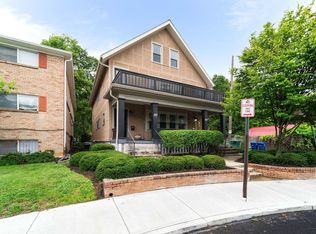
Income-producing 4-unit property generating $5,600/month ($67,200 annually) with tenants paying separate utilities, keeping owner expenses low and returns strong. Current cap rate approximately 8% with clear upside through cosmetic improvements and future rent increases.
All four units currently leased at $1,400/month, providing immediate and stable cash flow. Ideal opportunity for investors seeking a value-add property with forced appreciation potential and strong long-term rental demand.
Excellent fit for buy-and-hold investors, BRRRR strategy, or portfolio expansion. Opportunity to increase property value through interior updates and operational improvements.
Multi-family assets producing this level of income with upside potential are becoming increasingly rare at this price point.
For sale
$630,000
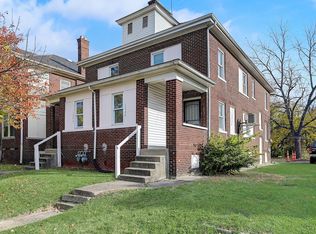
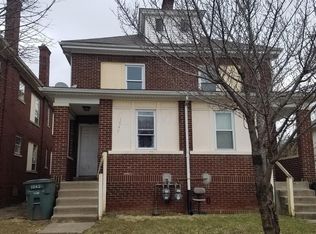
1038 Lockbourne Rd, Columbus, OH 43206
--beds
0baths
--sqft
Est.:
Condominium
Built in 1923
-- sqft lot
$-- Zestimate®
$--/sqft
$-- HOA
What's special
- 87 days |
- 129 |
- 9 |
Zillow last checked: 9 hours ago
Listing updated: February 18, 2026 at 03:34pm
Listed by:
Michael B Pillow 740-504-6251,
LPT Realty
Source: Columbus and Central Ohio Regional MLS ,MLS#: 226001615
Tour with a local agent
Facts & features
Interior
Bedrooms & bathrooms
- Bathrooms: 0
Property
Parking
- Total spaces: 4
Lot
- Size: 7,405.2 Square Feet
Details
- Parcel number: 010049673
- Zoning description: Commercial
Construction
Type & style
- Home type: MultiFamily
- Property subtype: Condominium
Condition
- Year built: 1923
- Major remodel year: 2025
Utilities & green energy
- Sewer: Public Sewer
- Water: Public
Community & HOA
Location
- Region: Columbus
Financial & listing details
- Tax assessed value: $366,900
- Annual tax amount: $9,532
- Date on market: 1/16/2026
Estimated market value
Not available
Estimated sales range
Not available
Not available
Price history
Price history
| Date | Event | Price |
|---|---|---|
| 1/16/2026 | Listed for sale | $630,000-1.3% |
Source: | ||
| 1/5/2026 | Listing removed | $638,000 |
Source: | ||
| 12/14/2025 | Listed for sale | $638,000-5.5% |
Source: | ||
| 11/13/2025 | Listing removed | $675,000 |
Source: | ||
| 10/16/2025 | Listed for sale | $675,000+0.8% |
Source: | ||
| 7/15/2025 | Listing removed | $669,900 |
Source: | ||
| 5/9/2025 | Price change | $669,900-2.9% |
Source: | ||
| 4/11/2025 | Listed for sale | $689,900+6.1% |
Source: | ||
| 5/25/2024 | Listing removed | -- |
Source: | ||
| 2/1/2024 | Price change | $650,000-4.4% |
Source: | ||
| 5/10/2023 | Price change | $680,000+1.5% |
Source: | ||
| 2/18/2023 | Price change | $670,000-0.7% |
Source: | ||
| 12/13/2022 | Price change | $675,000-3.6% |
Source: | ||
| 12/8/2022 | Price change | $700,000-3.4% |
Source: | ||
| 11/30/2022 | Listed for sale | $725,000+7.4% |
Source: | ||
| 6/3/2022 | Listing removed | -- |
Source: Zillow Rental Network_1 Report a problem | ||
| 6/1/2022 | Price change | $1,400+1.8% |
Source: Zillow Rental Network_1 Report a problem | ||
| 5/27/2022 | Price change | $1,375-3.2% |
Source: Zillow Rental Network_1 Report a problem | ||
| 5/25/2022 | Price change | $1,420-5.3% |
Source: Zillow Rental Network_1 Report a problem | ||
| 5/19/2022 | Price change | $1,500-6.3% |
Source: Zillow Rental Network_1 Report a problem | ||
| 5/12/2022 | Listed for rent | $1,600 |
Source: Zillow Rental Network_1 Report a problem | ||
| 5/10/2022 | Sold | $675,000+12.7% |
Source: | ||
| 3/30/2022 | Pending sale | $599,000 |
Source: | ||
| 3/30/2022 | Contingent | $599,000 |
Source: | ||
| 3/25/2022 | Listed for sale | $599,000+88.4% |
Source: | ||
| 6/21/2021 | Sold | $318,000-17.4% |
Source: | ||
| 5/24/2021 | Pending sale | $385,000+369.5% |
Source: | ||
| 3/11/2005 | Sold | $82,000-3% |
Source: Public Record Report a problem | ||
| 10/5/2004 | Sold | $84,500-33.7% |
Source: Public Record Report a problem | ||
| 11/16/1999 | Sold | $127,500 |
Source: Public Record Report a problem | ||
Public tax history
Public tax history
| Year | Property taxes | Tax assessment |
|---|---|---|
| 2024 | $9,532 +1.6% | $128,420 |
| 2023 | $9,381 +178.3% | $128,420 +185.8% |
| 2022 | $3,370 -0.4% | $44,940 |
| 2021 | $3,385 +0.7% | $44,940 |
| 2020 | $3,361 +9% | $44,940 +20% |
| 2019 | $3,084 +0.3% | $37,450 |
| 2018 | $3,075 | $37,450 |
| 2017 | $3,075 +26.2% | $37,450 +33.8% |
| 2016 | $2,437 +7.7% | $28,000 |
| 2015 | $2,262 | $28,000 |
| 2014 | $2,262 +101.9% | $28,000 |
| 2013 | $1,120 -49% | $28,000 |
| 2011 | $2,199 -8.3% | $28,000 -10.4% |
| 2010 | $2,397 +2.2% | $31,255 |
| 2008 | $2,345 +18.4% | $31,255 |
| 2007 | $1,981 +0.2% | -- |
| 2006 | $1,977 +2.7% | -- |
| 2005 | $1,926 -29.4% | -- |
| 2004 | $2,729 +17% | -- |
| 2003 | $2,332 +1.1% | -- |
| 2002 | $2,306 -1.3% | -- |
| 2001 | $2,336 -0.8% | -- |
| 2000 | $2,355 | -- |
Find assessor info on the county website
Monthly payment
Est. payment
$3,834/mo
Principal & interest
$3094
Property taxes
$740
More affordability tools
Climate risks
Neighborhood: Driving Park
Nearby schools
GreatSchools rating
- 4/10Fairwood Alternative Elementary SchoolGrades: PK-6Distance: 0.7 mi
- 3/10South High SchoolGrades: 7-12Distance: 0.9 mi
Local experts in 43206

- Ohio
- Franklin County
- Columbus
- 43206
- Driving Park
- 1038 Lockbourne Rd
Nearby cities
Nearby neighborhoods
Nearby zip codes
Other Columbus Topics
