Adorable and clean little home on Bunn Ct. One or more of the photos has been virtually staged. The home can be sold alone or as a package with 2221 E Monroe and 2153 E Capitol ($230,000). One or more photos have been virtually staged.
For sale
$85,000
11 Bunn Ct, Springfield, IL 62703
3beds
900sqft
Single Family Residence, Residential
Built in ----
4,500 Square Feet Lot
$79,700 Zestimate®
$94/sqft
$-- HOA
What's special
- 14 days
- 698
- 78
Zillow last checked:
Listing updated:
Listed by:
Debra Sarsany Mobl:217-313-0580,
The Real Estate Group, Inc.
Source: RMLS Alliance as distributed by MLS GRID,MLS#: CA1047042 Originating MLS: Capital Area Association of Realtors
Facts & features
Interior
Bedrooms & bathrooms
- Bedrooms: 3
- Bathrooms: 1
- Full bathrooms: 1
Bedroom 1
- Level: Main
- Dimensions: 12ft 0in x 9ft 0in
Bedroom 2
- Level: Main
- Dimensions: 9ft 0in x 8ft 9in
Bedroom 3
- Level: Main
- Dimensions: 13ft 0in x 8ft 6in
Kitchen
- Level: Main
- Dimensions: 13ft 6in x 11ft 0in
Living room
- Level: Main
- Dimensions: 16ft 0in x 12ft 0in
Main level
- Area: 900
Heating
- Forced Air
Appliances
- Included: Range, Refrigerator
Features
- Basement: None
Interior area
- Total structure area: 900
- Total interior livable area: 900 sqft
Property
Lot
- Size: 4,500 Square Feet
- Dimensions: 50 x 90
- Features: Level
Details
- Parcel number: 22110104012
Construction
Type & style
- Home type: SingleFamily
- Architectural style: Ranch
- Property subtype: Single Family Residence, Residential
Materials
- Frame, Vinyl Siding
- Foundation: Slab
- Roof: Shingle
Condition
- New construction: No
Utilities & green energy
- Sewer: Public Sewer
- Water: Public
Community & HOA
Community
- Subdivision: None
Location
- Region: Springfield
Financial & listing details
- Price per square foot: $94/sqft
- Tax assessed value: $64,608
- Annual tax amount: $1,663
- Date on market: 10/8/2026
- Road surface type: Paved
Estimated market value
$79,700
$61,000 - $97,000
$1,105/mo
Price history
| Date | Event | Price |
|---|---|---|
| 10/22/2026 | Listed for sale | $85,000+23.2%$94/sqft |
Source:  RMLS Alliance as distributed by MLS GRID #CA1047042 Report a problem | ||
| 5/2/2025 | Sold | $69,000-1.3%$77/sqft |
Source: RMLS Alliance as distributed by MLS GRID #CA1035479 Report a problem | ||
| 4/7/2025 | Pending sale | $69,900$78/sqft |
Source: RMLS Alliance as distributed by MLS GRID #CA1035479 Report a problem | ||
| 4/4/2025 | Listed for sale | $69,900$78/sqft |
Source: RMLS Alliance as distributed by MLS GRID #CA1035479 Report a problem | ||
Public tax history
| Year | Property taxes | Tax assessment |
|---|---|---|
| 2025 | $1,663 +3.1% | $21,536 +7.5% |
| 2024 | $1,614 +2% | $20,034 +8% |
| 2023 | $1,583 +4.2% | $18,550 +5.7% |
| 2022 | $1,519 +3.3% | $17,555 +4.1% |
| 2021 | $1,471 +3.7% | $16,867 +1.1% |
| 2020 | $1,419 +7.4% | $16,684 +1.8% |
| 2019 | $1,321 | $16,393 +0.4% |
| 2018 | $1,321 +2.4% | $16,323 +1.6% |
| 2017 | $1,290 +3.2% | $16,073 +2.7% |
| 2016 | $1,250 +1.9% | $15,658 +2.3% |
| 2015 | $1,226 +1.7% | $15,305 +0.8% |
| 2014 | $1,206 +1.5% | $15,177 -1.1% |
| 2013 | $1,187 +0.5% | $15,339 -1.7% |
| 2012 | $1,181 +2.8% | $15,605 |
| 2011 | $1,149 +1.5% | $15,605 -0.3% |
| 2010 | $1,132 +2.8% | $15,657 +0.9% |
| 2009 | $1,102 +5.3% | $15,520 +3.2% |
| 2008 | $1,046 -7.9% | $15,039 -4.5% |
| 2007 | $1,135 -0.9% | $15,754 +1.6% |
| 2006 | $1,145 | $15,505 |
Find assessor info on the county website
Monthly payment
Est. payment
Payment breakdown
Explore the cost of this home by adjusting the details. Changes won't be saved.Climate risks
Neighborhood: 62703

Similar homes
- $84,9002 bd1 ba1k sqft2301 Yale Blvd, Springfield, IL 62703For Sale

 MLS ID #CA1047156, Joshua F Kruse, The Real Estate Group, Inc.. RMLS Alliance as distributed by MLS GRID
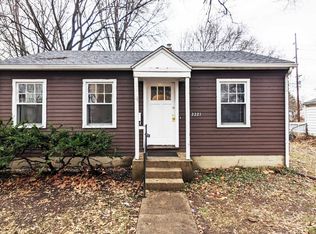
- $85,0003 bd2 ba1k sqft2221 E Monroe St, Springfield, IL 62703For Sale
 MLS ID #CA1047044, Debra Sarsany, The Real Estate Group, Inc.. RMLS Alliance as distributed by MLS GRID
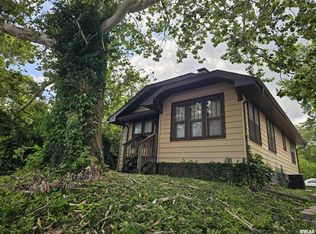
- $89,0003 bd2 ba956 sqft2229 S 6th St, Springfield, IL 62703For Sale
 MLS ID #CA1045563, Jessica Shaffer, Land & Home Real Estate. RMLS Alliance as distributed by MLS GRID
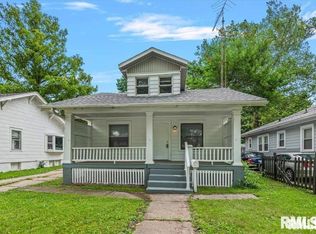
- $72,9002 bd1 ba1.1k sqft2516 S 10th St, Springfield, IL 62703For Sale
 MLS ID #CA1047038, Wesley Peterson, Keller Williams Capital. RMLS Alliance as distributed by MLS GRID
- $95,9002 bd1 ba916 sqft3004 S Allis St, Springfield, IL 62703For SaleMLS ID #CA1046140, Jan L Brewer, RE/MAX Professionals. RMLS Alliance as distributed by MLS GRID
- $79,9003 bd1 ba792 sqft420 S 16th St, Springfield, IL 62703For SaleMLS ID #CA1045878, Beverly Christian, Beverly Christian Real Estate. RMLS Alliance as distributed by MLS GRID
- $112,0002 bd1 ba1.2k sqft2316 S 9th St, Springfield, IL 62703For SaleMLS ID #CA1047229, Lacey Stephenson, Keller Williams Capital. RMLS Alliance as distributed by MLS GRID
- $118,0002 bd1 ba1k sqft3044 S 2nd St, Southern View, IL 62703For SaleMLS ID #CA1047242, Megan M Pressnall, The Real Estate Group, Inc.. RMLS Alliance as distributed by MLS GRID
- $124,9002 bd1 ba773 sqft1957 Lee St, Springfield, IL 62703For SaleMLS ID #CA1047240, Steve A Contri, RE/MAX Professionals. RMLS Alliance as distributed by MLS GRID
- $89,5002 bd2 ba1.1k sqft513 W Allen St, Springfield, IL 62704For SaleMLS ID #CA1046237, Laura Baragiola, RE/MAX Professionals. RMLS Alliance as distributed by MLS GRID
- $74,9002 bd1 ba804 sqft121 S Wesley St, Springfield, IL 62703For SaleMLS ID #CA1045297, Danielle Gipson, Keller Williams Capital. RMLS Alliance as distributed by MLS GRID
- $89,5002 bd1 ba873 sqft1912 Whittier Ave, Springfield, IL 62704For SaleMLS ID #CA1046463, Andrew Kinney, The Real Estate Group, Inc.. RMLS Alliance as distributed by MLS GRID
- $75,0001 bd1 ba624 sqft1604 N 32nd St, Springfield, IL 62702For SaleMLS ID #CA1047243, Kevin G Graham, Century 21 Real Estate Assoc. RMLS Alliance as distributed by MLS GRID
- $65,0003 bd2 ba1.2k sqft1117 S 12th St, Springfield, IL 62703For SaleMLS ID #CA1045384, Jerry George, The Real Estate Group, Inc.. RMLS Alliance as distributed by MLS GRID
- $115,0002 bd1 ba1k sqft1132 W Monroe St, Springfield, IL 62704For SaleMLS ID #CA1047246, Ben Call, The Real Estate Group, Inc.. RMLS Alliance as distributed by MLS GRID
- $49,9002 bd1 ba936 sqft1909 E Cedar St, Springfield, IL 62703For SaleMLS ID #CA1040649, Stephanie L Do, Do Realty Services, Inc.. RMLS Alliance as distributed by MLS GRID
