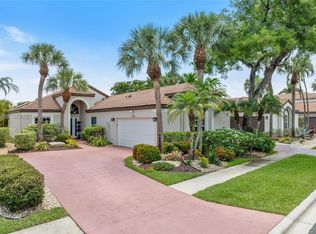
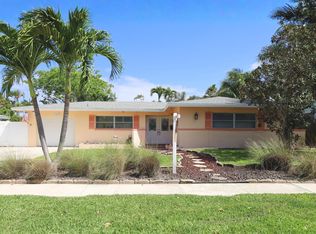
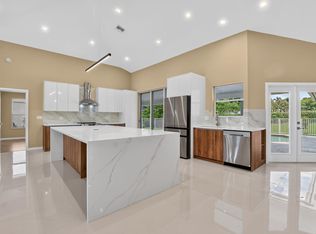
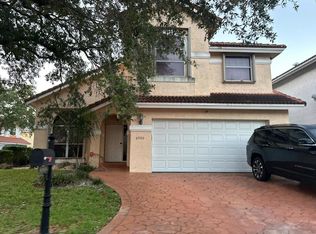
$1,285,500
3 bd2 ba3k sqft
1081 Parkside Cir N, Boca Raton, FL 33486
Off Market
Zillow last checked:
Listing updated:
Christine Ferguson 561-212-7920,
Regency Realty Services,
James Fisher 561-394-4600,
Regency Realty Services
 Originating MLS: BeachesMLS
Not available
Estimated sales range
Not available
$7,741/mo
| Date | Event | Price |
|---|---|---|
| 10/3/2026 | Listed for sale | $950,000+58.6%$315/sqft |
Source:  BeachesMLS #B26083803 Report a problem | ||
| 4/22/2014 | Listing removed | $599,000$198/sqft |
Source: Floridas Best Realty Service Report a problem | ||
| 11/26/2013 | Listed for sale | $599,000$198/sqft |
Source: Floridas Best Realty Service Report a problem | ||
| 7/12/2013 | Listing removed | $599,000$198/sqft |
Source: Floridas Best Realty Service Report a problem | ||
| 6/22/2013 | Listed for sale | $599,000+5.1%$198/sqft |
Source: Floridas Best Realty Service Report a problem | ||
| 4/23/2013 | Sold | $570,000-4.8%$189/sqft |
Source: Public Record Report a problem | ||
| 7/20/2012 | Listed for sale | $599,000-11.9%$198/sqft |
Source: Coldwell Banker Residential Real Estate - Boca Downtown #R3296851 Report a problem | ||
| 5/16/2005 | Sold | $680,000+6.3%$225/sqft |
Source: Public Record Report a problem | ||
| 2/1/2005 | Sold | $640,000+73%$212/sqft |
Source: Agent Provided Report a problem | ||
| 11/15/2000 | Sold | $370,000+34.5%$123/sqft |
Source: Public Record Report a problem | ||
| 9/9/1997 | Sold | $275,000$91/sqft |
Source: Public Record Report a problem | ||
| Year | Property taxes | Tax assessment |
|---|---|---|
| 2025 | $408 +2.8% | $915,424 +10% |
| 2024 | $397 +1.3% | $832,204 +10% |
| 2023 | $392 +1% | $756,549 +10% |
| 2022 | $388 +4.3% | $687,772 +10% |
| 2021 | $372 +1.2% | $625,247 +10% |
| 2020 | $368 -0.5% | $568,406 +2.7% |
| 2019 | $370 | $553,439 -0.2% |
| 2018 | $370 +2.8% | $554,747 -4.5% |
| 2017 | $360 +4.2% | $581,143 -3.2% |
| 2016 | $345 +7.3% | $600,215 +8.6% |
| 2015 | $322 -97% | $552,741 +1.6% |
| 2014 | $10,867 +41% | $543,882 +29.4% |
| 2013 | $7,705 +0.3% | $420,183 +1.7% |
| 2012 | $7,684 +2% | $413,159 +3% |
| 2011 | $7,531 +1.7% | $401,125 +1.5% |
| 2010 | $7,406 -5.4% | $395,197 -8.9% |
| 2009 | $7,832 -15.3% | $433,746 -21.5% |
| 2008 | $9,248 -14.4% | $552,252 -12.1% |
| 2007 | $10,808 -5.6% | $628,008 +2.5% |
| 2006 | $11,445 | $612,691 +91.1% |
| 2005 | -- | $320,627 +3% |
| 2004 | $3,184 +2223.1% | $311,288 +1.9% |
| 2003 | $137 -97.6% | $305,484 +2.4% |
| 2002 | $5,781 +0% | $298,324 +1.6% |
| 2001 | $5,781 +10.5% | $293,626 +9.4% |
| 2000 | $5,234 -3.3% | $268,414 +0.2% |
| 1999 | $5,415 | $268,010 |
Source: BeachesMLS. This data may not be complete. We recommend contacting the local school district to confirm school assignments for this home.

A local agent can set up tours, give advice and negotiate with sellers.
A local lender can help you make sure your offer is ready when you are.