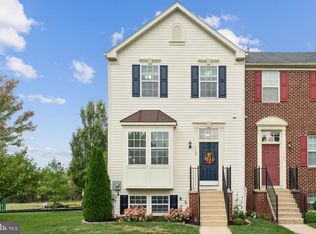
$451,800
4 bd|4 ba|1.6k sqft
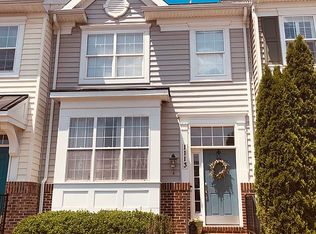
1113 Spring Run Ct, Frederick, MD 21702
Off Market
$429,200
$399,000 - $464,000
$2,742/mo
$2,742/mo
Rent Zestimate®
Find your next renter with Zillow Rental Manager. Plus, with online applications, you can quickly screen prospective tenants – for free.
$2,742/mo
Rent Zestimate®
$2,724/mo
Est. payment
Refinancing to a lower rate could help reduce your monthly payments and save thousands over the life of the loan.
$2,724/mo
Est. payment
Work with a Zillow partner agent
Leverage their expertise and Zillow's premium Showcase listings to get your home seen by more buyers.
Get startedList with your own agent
Get your home in front of millions of buyers by listing it on Zillow.
Learn how to do itSell it yourself
Take full control of how buyers see your home on Zillow by listing For Sale by Owner (FSBO).
List your homeZillow last checked:
Listing updated:
Lauren Olson 240-674-7744,
RE/MAX Results
John Heydon, 648436
Mackintosh, Inc.
| Date | Event | Price |
|---|---|---|
| 4/30/2026 | Sold | $430,000+1.2%$186/sqft |
Source: | ||
| 4/6/2026 | Pending sale | $425,000$183/sqft |
Source: | ||
| 4/6/2026 | Listed for sale | $425,000+44.1%$183/sqft |
Source: | ||
| 8/19/2016 | Sold | $295,000$127/sqft |
Source: Public Record Report a problem | ||
| 6/15/2016 | Pending sale | $295,000$127/sqft |
Source: Radcliffe Realty Group LLC #FR9683389 Report a problem | ||
| 6/10/2016 | Listed for sale | $295,000+25.5%$127/sqft |
Source: Radcliffe Realty Group LLC #FR9683389 Report a problem | ||
| 2/7/2012 | Sold | $235,000$101/sqft |
Source: Public Record Report a problem | ||
| 10/2/2011 | Price change | $235,000+2.6%$101/sqft |
Source: Long & Foster Real Estate #FR7577274 Report a problem | ||
| 7/17/2011 | Price change | $229,000-6.5%$99/sqft |
Source: Long & Foster Real Estate #FR7577274 Report a problem | ||
| 5/23/2011 | Price change | $244,9000%$106/sqft |
Source: Long & Foster Real Estate #FR7577274 Report a problem | ||
| 4/15/2011 | Listed for sale | $245,000+2.1%$106/sqft |
Source: Long & Foster Real Estate #FR7577274 Report a problem | ||
| 8/18/2010 | Listing removed | $239,900$103/sqft |
Source: Long & Foster Real Estate #FR7263706 Report a problem | ||
| 4/20/2010 | Listed for sale | $239,900$103/sqft |
Source: Long & Foster Real Estate, Inc. #FR7263706 Report a problem | ||
| 3/15/2010 | Listing removed | $239,900$103/sqft |
Source: Long & Foster Real Estate, Inc. #FR7263706 Report a problem | ||
| 2/26/2010 | Listed for sale | $239,900-42.8%$103/sqft |
Source: Long & Foster Real Estate, Inc. #FR7263706 Report a problem | ||
| 1/4/2007 | Sold | $419,217$181/sqft |
Source: Public Record Report a problem | ||
| Year | Property taxes | Tax assessment |
|---|---|---|
| 2025 | $6,910 -95.2% | $373,700 +8.7% |
| 2024 | $144,340 +2460% | $343,667 +9.6% |
| 2023 | $5,638 +11% | $313,633 +10.6% |
| 2022 | $5,080 +0.4% | $283,600 +0.5% |
| 2021 | $5,058 +0.9% | $282,100 |
| 2020 | $5,011 +0.6% | -- |
| 2019 | $4,981 +4.4% | $279,100 +4.4% |
| 2018 | $4,770 +45.8% | $267,400 -4.2% |
| 2017 | $3,271 -23.9% | $279,100 +14.4% |
| 2016 | $4,297 | $244,000 +1.6% |
| 2015 | $4,297 | $240,233 +1.6% |
| 2014 | $4,297 | $236,467 +1.6% |
| 2013 | -- | $232,700 |
| 2012 | -- | $232,700 |
| 2011 | -- | $232,700 -37.8% |
| 2010 | -- | $373,890 +8.6% |
| 2009 | -- | $344,392 +9.4% |
| 2008 | -- | $314,896 +10.3% |
| 2007 | -- | $285,400 +801.3% |
| 2006 | -- | $31,666 |
Find assessor info on the county website
Source: Bright MLS. This data may not be complete. We recommend contacting the local school district to confirm school assignments for this home.