Looking for a nice spacious, brick home? Look no further and come fall in love with your forever home. With tons of space for the occasion this house has it all. Close to great schools and in a desirable location this house won't last long.
For sale
$255,000
617 S Hemlock Ave, Roswell, NM 88203
3beds
1,420sqft
Single Family Residence
Built in 1958
9,583 Square Feet Lot
$248,300 Zestimate®
$180/sqft
$-- HOA
What's special
Brick home
- 17 days
- 152
- 1
Likely to sell faster than
Zillow last checked:
Listing updated:
Listed by:
Nathaniel Ortega 575-637-1966,
Keller Williams Roswell 575-600-6114
Source: New Mexico MLS,MLS#: 26001593
Facts & features
Interior
Bedrooms & bathrooms
- Bedrooms: 3
- Bathrooms: 2
- Full bathrooms: 2
- Main level bedrooms: 3
Features
- Has fireplace: No
Interior area
- Total structure area: 1,420
- Total interior livable area: 1,420 sqft
- Finished area above ground: 1,420
Property
Parking
- Total spaces: 2
- Parking features: Garage
- Garage spaces: 2
Lot
- Size: 9,583 Square Feet
Details
- Parcel number: 4134062081323000000
Construction
Type & style
- Home type: SingleFamily
- Architectural style: Conventional
- Property subtype: Single Family Residence
Condition
- Year built: 1958
Community & HOA
Community
- Subdivision: DAY 2
HOA
- Has HOA: No
Location
- Region: Roswell
Financial & listing details
- Price per square foot: $180/sqft
- Tax assessed value: $103,659
- Annual tax amount: $884
- Date on market: 10/5/2026
- Listing agreement: Exclusive Right To Sell
Estimated market value
$248,300
$236,000 - $261,000
$1,397/mo
Price history
| Date | Event | Price |
|---|---|---|
| 10/5/2026 | Listed for sale | $255,000$180/sqft |
Source:  New Mexico MLS #26001593 Report a problem | ||
Public tax history
| Year | Property taxes | Tax assessment |
|---|---|---|
| 2025 | $857 -0.9% | $34,553 +3% |
| 2024 | $865 -0.1% | $33,547 +3% |
| 2023 | $866 +4.2% | $32,570 +3% |
| 2022 | $832 +2% | $31,621 +3% |
| 2021 | $816 +2.1% | $30,700 +3% |
| 2020 | $798 +3.5% | $29,806 +3% |
| 2019 | $771 +0.9% | $28,938 0% |
| 2018 | $765 +2.2% | $28,947 +1.1% |
| 2017 | $748 -2.7% | $28,629 -1% |
| 2016 | $768 -4.6% | $28,915 +3% |
| 2015 | $805 -48.4% | $28,073 +3% |
| 2014 | $1,561 +113.2% | $27,255 +3% |
| 2013 | $732 | $26,462 +3% |
| 2012 | -- | $25,691 +3% |
| 2011 | -- | $24,943 |
Find assessor info on the county website
Monthly payment
Est. payment
Payment breakdown
Explore the cost of this home by adjusting the details. Changes won't be saved.Climate risks
Neighborhood: 88203

Similar homes
- $219,5003 bd2 ba1.6k sqft716 S Cedar Ave, Roswell, NM 88203For Sale
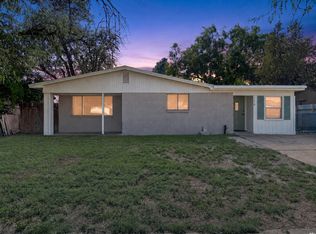 MLS ID #26000396, Matthew Jauriqui. New Mexico MLS
- $209,0003 bd2 ba1.3k sqft1009 Ivy Dr, Roswell, NM 88203For Sale
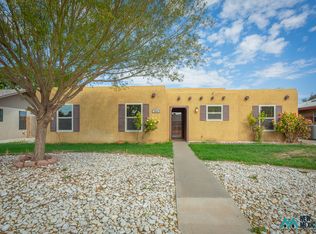 MLS ID #26001935, Daisy Olaguez. New Mexico MLS
- $215,0004 bd2 ba1.5k sqft405 S Fir Ave, Roswell, NM 88203For Sale
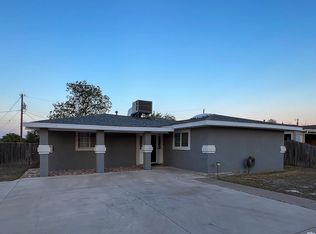 MLS ID #26000410, Josh Berry. New Mexico MLS
- $199,0004 bd2 ba1.7k sqft710 S Wyoming Ave, Roswell, NM 88203For Sale
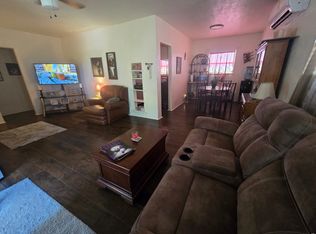 MLS ID #26000150, Claudia Gomez. New Mexico MLS
