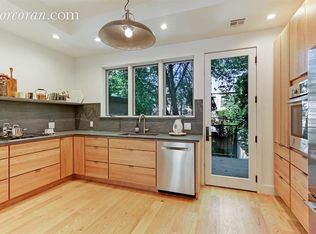
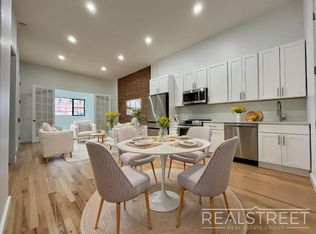
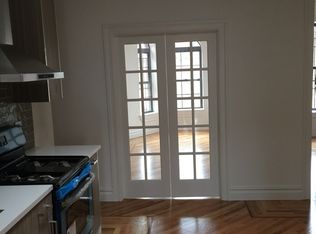
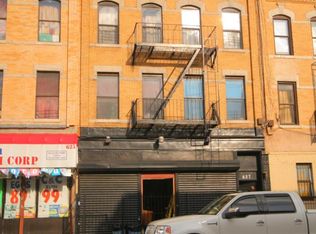
1198 Decatur St, Brooklyn, NY 11207 is a multi family home that contains 2,886 sq ft and was built in 2006. It contains 9 bedrooms and 6 bathrooms. This home last sold for $1,635,000 in December 2024.
The Zestimate for this house is $1,536,100. The Rent Zestimate for this home is $4,040/mo.
Sold for $1,635,000
$1,635,000
1198 Decatur St, Brooklyn, NY 11207
9beds
2,886sqft
MultiFamily
Built in 2006
-- sqft lot
$1,536,100 Zestimate®
$567/sqft
$4,040 Estimated rent
Home value
$1,536,100
$1.46M - $1.61M
$4,040/mo
Zestimate® history
Owner options
List your home for rent
$4,040/mo
Rent Zestimate®
Find your next renter with Zillow Rental Manager. Plus, with online applications, you can quickly screen prospective tenants – for free.
$4,040/mo
Rent Zestimate®
Refinance and save
$7,893/mo
Est. payment
Refinancing to a lower rate could help reduce your monthly payments and save thousands over the life of the loan.
$7,893/mo
Est. payment
Explore your selling options
Work with a Zillow partner agent
Leverage their expertise and Zillow's premium Showcase listings to get your home seen by more buyers.
Get startedList with your own agent
Get your home in front of millions of buyers by listing it on Zillow.
Learn how to do itSell it yourself
Take full control of how buyers see your home on Zillow by listing For Sale by Owner (FSBO).
List your homeWhat's special
Facts & features
Price history
| Date | Event | Price |
|---|---|---|
| 6/20/2026 | Listing removed | $1,649,000+3.1%$571/sqft |
Source: StreetEasy #S1811327 Report a problem | ||
| 4/24/2026 | Price change | $1,599,000-2.1%$554/sqft |
Source: | ||
| 3/17/2026 | Price change | $1,634,000-0.9%$566/sqft |
Source: | ||
| 2/17/2026 | Listed for sale | $1,649,000$571/sqft |
Source: StreetEasy #S1811327 Report a problem | ||
| 2/17/2026 | Contingent | $1,649,000$571/sqft |
Source: StreetEasy #S1811327 Report a problem | ||
| 2/3/2026 | Listed for sale | $1,649,000+0.9%$571/sqft |
Source: | ||
| 12/9/2024 | Sold | $1,635,000+25.8%$567/sqft |
Source: Public Record Report a problem | ||
| 10/12/2022 | Listing removed | -- |
Source: | ||
| 9/17/2022 | Listed for sale | $1,300,000+19.8%$450/sqft |
Source: | ||
| 11/2/2016 | Sold | $1,085,000-1.2%$376/sqft |
Source: Public Record Report a problem | ||
| 4/6/2016 | Price change | $1,098,000-8.1%$380/sqft |
Source: CENTURY 21 Homefront #DC1198D Report a problem | ||
| 1/23/2016 | Price change | $1,195,000-0.4%$414/sqft |
Source: Century 21 Homefront Realty #398590 Report a problem | ||
| 12/3/2015 | Price change | $1,199,900-4%$416/sqft |
Source: Better Homes and Gardens Real Estate Amiable II #1198 Report a problem | ||
| 9/30/2015 | Listed for sale | $1,250,000+681.3%$433/sqft |
Source: CENTURY 21 Amiable II #1198 Report a problem | ||
| 8/3/2005 | Sold | $160,000$55/sqft |
Source: Public Record Report a problem | ||
Public tax history
| Year | Property taxes | Tax assessment |
|---|---|---|
| 2025 | $9,577 +4.7% | $76,620 +4.6% |
| 2024 | $9,145 | $73,260 +11.3% |
| 2023 | -- | $65,820 -6.1% |
| 2022 | -- | $70,080 +10.4% |
| 2021 | -- | $63,480 +7.6% |
| 2020 | $8,513 +6% | $58,980 +14.6% |
| 2019 | $8,032 +4.6% | $51,480 +40.2% |
| 2018 | $7,681 +6.8% | $36,720 +4.1% |
| 2017 | $7,192 +4.2% | $35,280 |
| 2016 | $6,899 | $35,280 +5.3% |
| 2015 | $6,899 +71.9% | $33,517 +6% |
| 2014 | $4,014 | $31,620 +3.3% |
| 2013 | -- | $30,600 +4.1% |
| 2012 | -- | $29,400 -15.1% |
| 2011 | -- | $34,620 -17.6% |
| 2010 | -- | $42,000 +35.2% |
| 2009 | -- | $31,074 +0.3% |
| 2008 | -- | $30,982 +17.3% |
| 2007 | -- | $26,408 |
Find assessor info on the county website
Neighborhood: East New York
Nearby schools
GreatSchools rating
- 9/10Ps 149 Danny KayeGrades: PK-5Distance: 0.1 mi
- 5/10Jhs 292 Margaret S DouglasGrades: 6-8Distance: 0.1 mi
- NABARD HIGH SCHOOL EARLY COLLEGE BROOKLYNGrades: 9,11Distance: 0.1 mi
- New York
- Kings County
- New York
- 11207
- Brooklyn
- East New York
- 1198 Decatur St
Nearby cities
Nearby neighborhoods
Nearby zip codes
Other New York Topics
