Rare opportunity to acquire two identical five-story multifamily buildings comprising 16 residential units, with eight units in each building.
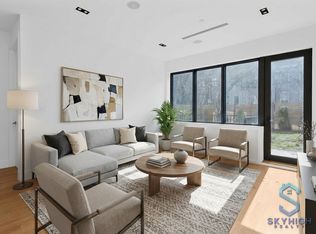
Constructed in 2018 as new-development condominiums with high-end finishes, the properties are fully occupied and positioned in one of Brooklyn’s most up-and-coming rental markets.
Strong tenant demand, below-market rents, and significant potential to increase rental income provide an attractive opportunity to grow cash flow and long-term value. The properties also benefit from a 30-year 421-a tax abatement, with combined annual real estate taxes of only $4,433.
Investment Highlights:
• 16 residential units
• 15,240 total square feet
• $507,423 current NOI
• $643 per square foot
• 5.26% current cap rate
• 6.15% pro forma cap rate
• Fully occupied
• 30-year 421-a tax abatement
OM and data available upon request.
Active
$9,800,000
1200 Decatur St, Brooklyn, NY 11207
18beds
15,240sqft
Multi Family
Built in 2018
-- sqft lot
$-- Zestimate®
$643/sqft
$-- HOA
What's special
Five-story multifamily buildingsHigh-end finishes
- 7 days
- 157
- 12
Zillow last checked:
Listing updated:
Listed by:
Compass 212-380-1375,
Yoav Blat
Source: StreetEasy,MLS#: S1854832
Facts & features
Interior
Bedrooms & bathrooms
- Bedrooms: 18
- Bathrooms: 22
- Full bathrooms: 22
Features
- Has fireplace: No
Interior area
- Total structure area: 15,240
- Total interior livable area: 15,240 sqft
Property
Details
- Parcel number: 034350013
- Special conditions: Resale
Construction
Type & style
- Home type: MultiFamily
- Property subtype: Multi Family
Condition
- Year built: 2018
Community & HOA
Community
- Subdivision: Bushwick
Location
- Region: Brooklyn
Financial & listing details
- Price per square foot: $643/sqft
- Tax assessed value: $1,461,000
- Annual tax amount: $4,464
- Date on market: 10/27/2026
Estimated market value
Not available
Estimated sales range
Not available
$5,066/mo
Price history
| Date | Event | Price |
|---|---|---|
| 10/27/2026 | Listed for sale | $9,800,000$643/sqft |
Source: StreetEasy #S1854832 Report a problem | ||
| 10/26/2026 | Contingent | $9,800,000+979.9%$643/sqft |
Source: StreetEasy #S1854832 Report a problem | ||
| 7/5/2024 | Listing removed | -- |
Source: Zillow Rentals Report a problem | ||
| 6/28/2024 | Listed for rent | $2,850 |
Source: Zillow Rentals Report a problem | ||
| 11/30/2017 | Sold | $907,500+31.5%$60/sqft |
Source: Public Record Report a problem | ||
| 6/14/2006 | Sold | $690,000+68.3%$45/sqft |
Source: Public Record Report a problem | ||
| 10/25/2005 | Sold | $410,000$27/sqft |
Source: Public Record Report a problem | ||
Public tax history
| Year | Property taxes | Tax assessment |
|---|---|---|
| 2025 | $58,759 -0.5% | $657,450 +11.6% |
| 2024 | $59,057 | $589,050 +8% |
| 2023 | -- | $545,400 +13.9% |
| 2022 | -- | $478,800 +2.1% |
| 2021 | -- | $468,900 +81.2% |
| 2020 | $27,923 +1081.2% | $258,750 +367.5% |
| 2019 | $2,364 -43.9% | $55,350 +174.6% |
| 2018 | $4,216 +2.6% | $20,154 |
| 2017 | $4,108 +5.3% | $20,154 +1% |
| 2016 | $3,903 | $19,962 +6% |
| 2015 | $3,903 +70.2% | $18,835 +5.9% |
| 2014 | $2,293 | $17,791 +5.9% |
| 2013 | -- | $16,795 |
| 2012 | -- | $16,795 +1% |
| 2011 | -- | $16,635 +6% |
| 2010 | -- | $15,696 +5.9% |
| 2009 | -- | $14,826 +5.9% |
| 2008 | -- | $13,996 |
| 2007 | -- | $13,996 +1% |
| 2006 | -- | $13,863 +6% |
| 2005 | -- | $13,080 +5.9% |
| 2004 | -- | $12,355 +5.9% |
| 2003 | -- | $11,664 |
| 2002 | -- | $11,664 +1% |
| 2001 | -- | $11,553 +6% |
| 2000 | -- | $10,900 |
Find assessor info on the county website
Monthly payment
Climate risks
Neighborhood: Bushwick


Similar homes
- $7,095,55516 bd9 ba9k sqft614 Woodward Avenue, Ridgewood, NY 11385For Sale

 MLS ID #1065880, Amberly Sclar, Listing by: BLT Minimax Realty Inc. OneKey® MLS as distributed by MLS GRID
- $5,100,00015 bd-- ba10k sqft1086 Myrtle Avenue, Brooklyn, NY 11206For Sale
 MLS ID #1050736, Natalie Efraimov, Listing by: 5 Boro Realty Corp. OneKey® MLS as distributed by MLS GRID
- $7,500,00020 bd14 ba13k sqft7910 4th Ave, Brooklyn, NY 11209Active
 MLS ID #S1854985, Hui Yu, Listing by: Compass. StreetEasy
- $6,500,00017 bd16 ba12k sqft45-35 47th St #1, Woodside, NY 11377Active
 MLS ID #S1688191, Raymond Wong, Listing by: Apple Realty Group Corp. StreetEasy
