WELL BELOW APPRAISED VALUE! Built in an era of solid traditional designs, this is your classic ranch style all brick home with nearly 2,000 square feet of living space nestled on an expansive 14 acres of wooded privacy. Some of the features are a large dining room, bright vaulted sunroom that steps out onto a deck for grilling, and extending into the beautiful natural landscape. So much you can do with this much square footage in house and land!
For sale by owner
Price increase: $20K (10/9)
$429,900
12276 Flat Shoals Rd, Covington, GA 30016
3beds
1,942sqft
SingleFamily
Built in 1972
14 Acres Lot
$415,000 Zestimate®
$221/sqft
$-- HOA
What's special
Deck for grillingBright vaulted sunroomLarge dining roomBeautiful natural landscape
- 74 days
- 580
- 47
Listed by:
Property Owner (770) 842-0659
Facts & features
Interior
Bedrooms & bathrooms
- Bedrooms: 3
- Bathrooms: 3
- Full bathrooms: 2
- 1/2 bathrooms: 1
Heating
- Other
Cooling
- Central
Appliances
- Included: Dishwasher, Microwave, Range / Oven, Refrigerator
Features
- Flooring: Tile, Carpet, Hardwood
- Basement: None
- Has fireplace: Yes
Interior area
- Total interior livable area: 1,942 sqft
Property
Parking
- Parking features: Carport
Features
- Exterior features: Brick
Lot
- Size: 14 Acres
Details
- Parcel number: 0066000000031000
Construction
Type & style
- Home type: SingleFamily
Materials
- Wood
- Foundation: Masonry
- Roof: Composition
Condition
- New construction: No
- Year built: 1972
Community & HOA
Location
- Region: Covington
Financial & listing details
- Price per square foot: $221/sqft
- Tax assessed value: $314,000
- Annual tax amount: $2,055
- Date on market: 8/9/2026
Estimated market value
$415,000
$394,000 - $436,000
$2,111/mo
Price history
| Date | Event | Price |
|---|---|---|
| 10/9/2026 | Price change | $419,900+5%$216/sqft |
Source:  GAMLS #10870135 Report a problem | ||
| 9/4/2026 | Price change | $399,900-4.8%$206/sqft |
Source: GAMLS #10839999 Report a problem | ||
| 8/21/2026 | Price change | $419,900-4.5%$216/sqft |
Source: GAMLS #10825821 Report a problem | ||
| 8/14/2026 | Price change | $439,900+2.3%$227/sqft |
Source: GAMLS #10825821 Report a problem | ||
| 8/9/2026 | Listed for sale | $429,900-4.4%$221/sqft |
Source: Owner Report a problem | ||
| 8/4/2026 | Listing removed | $449,900$232/sqft |
Source: GAMLS #10805252 Report a problem | ||
| 7/25/2026 | Price change | $449,900-4.3%$232/sqft |
Source: GAMLS #10805252 Report a problem | ||
| 7/14/2026 | Listed for sale | $469,900-6%$242/sqft |
Source: GAMLS #10805252 Report a problem | ||
| 7/14/2026 | Listing removed | $499,900$257/sqft |
Source: GAMLS #10794060 Report a problem | ||
| 6/26/2026 | Listed for sale | $499,900+5.3%$257/sqft |
Source: GAMLS #10794060 Report a problem | ||
| 6/25/2026 | Listing removed | $474,900$245/sqft |
Source: GAMLS #10777472 Report a problem | ||
| 6/3/2026 | Listed for sale | $474,900-5%$245/sqft |
Source: GAMLS #10777472 Report a problem | ||
| 6/2/2026 | Listing removed | $499,900$257/sqft |
Source: GAMLS #10763109 Report a problem | ||
| 5/13/2026 | Listed for sale | $499,900$257/sqft |
Source: GAMLS #10763109 Report a problem | ||
Public tax history
| Year | Property taxes | Tax assessment |
|---|---|---|
| 2025 | $2,055 +6.2% | $125,600 +5.2% |
| 2024 | $1,935 -10.4% | $119,360 +4.5% |
| 2023 | $2,161 +32.8% | $114,240 +34.3% |
| 2022 | $1,627 +9.5% | $85,040 +8.9% |
| 2021 | $1,486 +9.1% | $78,120 +13% |
| 2020 | $1,363 +9.3% | $69,160 +5.6% |
| 2019 | $1,246 +7.3% | $65,520 +3.9% |
| 2018 | $1,161 +4.6% | $63,040 +2.4% |
| 2017 | $1,110 0% | $61,560 +18.4% |
| 2016 | $1,110 | $52,000 -1.1% |
| 2015 | $1,110 +60.9% | $52,560 +6.1% |
| 2014 | $690 | $49,520 +0.9% |
| 2013 | -- | $49,080 -9.3% |
| 2012 | -- | $54,120 -10.2% |
| 2011 | -- | $60,280 -2.1% |
| 2010 | -- | $61,560 -6.3% |
| 2009 | -- | $65,680 -61% |
| 2008 | $1,765 | $168,268 |
| 2007 | $1,765 +0.3% | $168,268 +0.4% |
| 2006 | $1,760 -0.7% | $167,668 -0.5% |
| 2005 | $1,773 +8.8% | $168,568 +4.6% |
| 2004 | $1,629 +3.3% | $161,168 +2.3% |
| 2003 | $1,577 | $157,468 |
Find assessor info on the county website
Monthly payment
Est. payment
Payment breakdown
Explore the cost of this home by adjusting the details. Changes won't be saved.Climate risks
Neighborhood: 30016
- $322,1003 bd2 ba1.6k sqft12344 Flat Shoals Rd, Covington, GA 30016Off Market

- $208,900-- bd-- ba-- sqft11906 Highway 36, Covington, GA 30014Off Market
- $238,8003 bd2 ba1.6k sqft12324 Flat Shoals Rd, Covington, GA 30016Off Market

- $196,000-- bd1 ba1.2k sqft12345 Flat Shoals Rd, Covington, GA 30016Off Market
Similar homes
- $--4 bd2 ba1.5k sqft25 Laurie Ln, Covington, GA 30016Auction
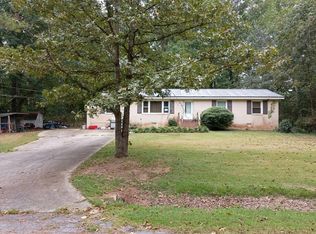 Auction.com 2
- $--3 bd2 ba1.8k sqft1331 Pickett Bridge Rd, Covington, GA 30016Auction
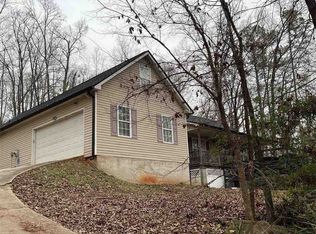 Auction.com 1
- $--3 bd2 ba1.2k sqft11268 Flat Shoals Rd, Covington, GA 30016Auction
 ServiceLink Auction
- $--4 bd2 ba1.8k sqft165 Ella Dr, Covington, GA 30016Auction
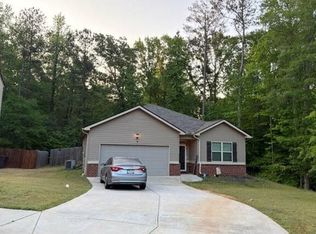 Auction.com 2
- $459,0003 bd2 ba2.3k sqft217 Forrester Cemetery Rd, Covington, GA 30014Active
 MLS ID #10869468, Audrey Morris, Morris Realty Co LLC. GAMLS
- $467,9005 bd4 ba2.7k sqft450 E End Rd, Covington, GA 30014ActiveMLS ID #10846632, Jacques W Hall Jr, Watch Realty Co. GAMLS
- $275,0003 bd2 ba2.1k sqft1600 Mote Rd, Covington, GA 30016ActiveMLS ID #10827749, Felicia Benton, Redeemer Realty. GAMLS
- $375,0003 bd2 ba2.2k sqft5175 Forest Dr SE, Covington, GA 30014ActiveMLS ID #10674605, Shelly B Holifield, Legend Realty Group LLC. GAMLS
- $309,9004 bd2 ba1.7k sqft435 Butler Bridge Cir, Covington, GA 30016ActiveMLS ID #10834933, Hillary Nchotu, First United Realty, Inc.. GAMLS
- $639,0003 bd5 ba2.2k sqft2131 Highway 81, Oxford, GA 30054ActiveMLS ID #10876336, Laura Nerbonne, AXEN Realty. GAMLS
- $360,0003 bd3 ba2.1k sqft3000 White Pine Ln, Mansfield, GA 30055ActiveMLS ID #10867757, Benjamin Dee Blanton, Redeemer Realty. GAMLS
- $240,0003 bd2 ba1.9k sqft46 Russell Braden Rd, Covington, GA 30016ActiveMLS ID #10835408, Pam Bettis Price, Boutique Realty. GAMLS
- $325,0004 bd3 ba1.5k sqft20 Hollow Ct, Covington, GA 30016For Sale
 MLS ID #7699864, Adrienne Kizito, Real Broker, LLC.. FMLS GA
