Beautiful single story. Charming three-bedrooms, 2 bath home perfect for families and individuals looking for a cozy living space. Spacious bedrooms. Large kitchen open to the family room, granite countertops, fireplace. Plenty of outdoor space. RV parking. Inground pool for the summer. It will not last.
Pre-foreclosure
Listed by: L&L URIBE, INC • LUIS URIBE • Lfu1751@gmail.com
Est. $408,100
12650 Running Deer Rd, Apple Valley, CA 92308
3beds
1,491sqft
Single Family Residence
Built in 1978
0.42 Acres Lot
$408,100 Zestimate®
$274/sqft
$-- HOA
Overview
- 44 days
- 7
- 0
Zillow last checked:
Listing updated:
Listed by:
LUIS URIBE DRE #00700181 Lfu1751@gmail.com,
L&L URIBE, INC
Source: CRMLS,MLS#: IV24255182 Originating MLS: California Regional MLS
Facts & features
Interior
Bedrooms & bathrooms
- Bedrooms: 3
- Bathrooms: 2
- Full bathrooms: 2
- Main level bathrooms: 2
- Main level bedrooms: 3
Rooms
- Room types: Bedroom
Bedroom
- Features: All Bedrooms Down
Heating
- Central
Cooling
- Central Air
Appliances
- Laundry: Laundry Room
Features
- All Bedrooms Down
- Has fireplace: Yes
- Fireplace features: Family Room
- Common walls with other units/homes: No Common Walls
Interior area
- Total interior livable area: 1,491 sqft
Property
Parking
- Total spaces: 2
- Parking features: Garage - Attached
- Attached garage spaces: 2
Features
- Levels: One
- Stories: 1
- Entry location: main
- Has private pool: Yes
- Pool features: In Ground, Private
- Spa features: None
- View description: None
Lot
- Size: 0.42 Acres
Details
- Parcel number: 3087465020000
- Special conditions: Standard
Construction
Type & style
- Home type: SingleFamily
- Property subtype: Single Family Residence
Condition
- New construction: No
- Year built: 1978
Utilities & green energy
- Sewer: Unknown
- Water: Public
Community & HOA
Community
- Features: Valley
Location
- Region: Apple Valley
Financial & listing details
- Price per square foot: $274/sqft
- Tax assessed value: $236,758
- Date on market: 12/30/2024
- Cumulative days on market: 273 days
- Listing terms: Cash,Cash to New Loan
Foreclosure details
Estimated market value
$408,100
$367,000 - $453,000
$2,604/mo
Price history
| Date | Event | Price |
|---|---|---|
| 2/23/2026 | Sold | $410,000-1.4%$275/sqft |
Source:  CRMLS #IV24255182 Report a problem | ||
| 1/20/2026 | Pending sale | $415,990$279/sqft |
Source: CRMLS #IV24255182 Report a problem | ||
| 12/13/2025 | Listing removed | $415,990-2.1%$279/sqft |
Source:  SDMLS #IV24255182 Report a problem | ||
| 9/6/2025 | Listing removed | $424,900-1.2%$285/sqft |
Source: SDMLS #IV24255182 Report a problem | ||
| 6/24/2025 | Listed for sale | $429,900+313.4%$288/sqft |
Source: SDMLS #IV24255182 Report a problem | ||
| 1/31/2017 | Sold | $104,000$70/sqft |
Source: Public Record Report a problem | ||
Public tax history
| Year | Property taxes | Tax assessment |
|---|---|---|
| 2026 | -- | $236,758 +2% |
| 2025 | $2,744 +2.9% | $232,116 +2% |
| 2024 | $2,667 +0.9% | $227,564 +2% |
| 2023 | $2,643 +1.5% | $223,102 +2% |
| 2022 | $2,603 +2.3% | $218,728 +2% |
| 2021 | $2,543 +1.2% | $214,440 +1% |
| 2020 | $2,513 +1.9% | $212,241 +2% |
| 2019 | $2,466 +2.5% | $208,080 +2% |
| 2018 | $2,406 +43.9% | $204,000 +47.6% |
| 2017 | $1,671 | $138,182 +2% |
| 2016 | $1,671 +10.6% | $135,473 +1.5% |
| 2015 | $1,511 +1.6% | $133,438 +2% |
| 2014 | $1,488 | $130,824 +0.5% |
| 2013 | -- | $130,233 +2% |
| 2012 | -- | $127,679 +2% |
| 2011 | -- | $125,175 +0.8% |
| 2010 | -- | $124,239 -0.2% |
| 2009 | -- | $124,535 +2% |
| 2008 | -- | $122,093 +2% |
| 2007 | -- | $119,699 +2% |
| 2006 | -- | $117,352 +2% |
| 2005 | -- | $115,051 +2% |
| 2004 | -- | $112,795 +1.9% |
| 2003 | -- | $110,727 +2% |
| 2002 | -- | $108,556 +2% |
| 2001 | -- | $106,427 +2% |
| 2000 | -- | $104,340 |
Find assessor info on the county website
Monthly payment
Climate risks
Neighborhood: 92308
- $384,5003 bd2 ba1.5k sqft21511 Lone Eagle Rd, Apple Valley, CA 92308Off Market

- $431,7003 bd2 ba1.5k sqft12634 Running Deer Rd, Apple Valley, CA 92308Off Market
- $374,4003 bd2 ba1.3k sqft12649 Clallam Rd, Apple Valley, CA 92308Off Market

- $372,7003 bd2 ba1.2k sqft12665 Clallam Rd, Apple Valley, CA 92308Off Market

Similar homes
- $415,0003 bd2 ba1.2k sqft12724 Algonquin Rd, Apple Valley, CA 92308For Sale
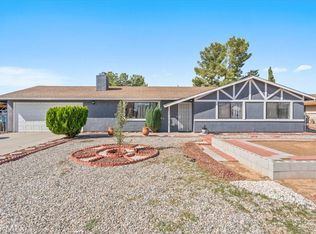 MLS ID #IV26230082, ROSA LEONE, Real Brokerage Technologies. CRMLS
- $414,9003 bd2 ba1.5k sqft21775 Sioux Rd, Apple Valley, CA 92308For Sale
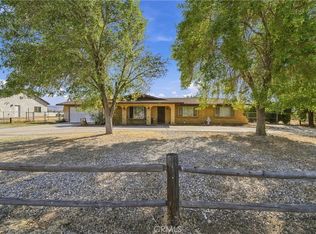 MLS ID #DW26233092, Victor Gutierrez, Century 21 LOTUS. CRMLS
- $--3 bd2 ba1.1k sqft11734 Chimayo Rd, Apple Valley, CA 92308Auction
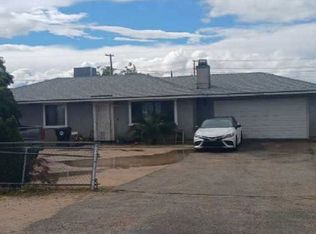 Xome
- $379,0003 bd2 ba1.1k sqft12787 Algonquin Rd, Apple Valley, CA 92308For Sale
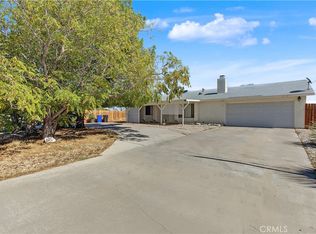 MLS ID #IG26209684, Cesar Diaz, eXp Realty of Greater Los Angeles, Inc.. CRMLS
