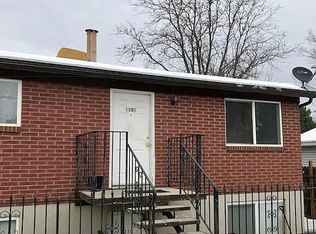
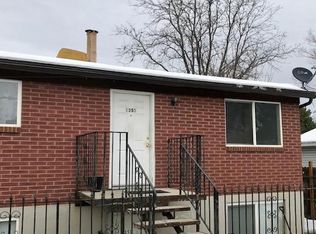
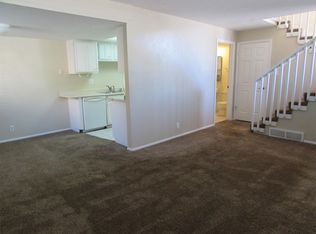
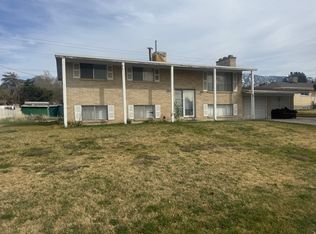
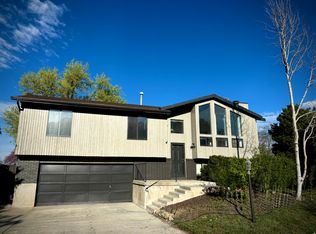
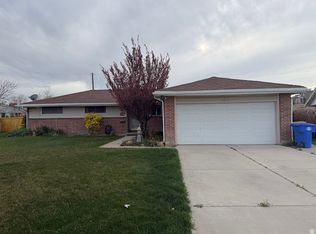
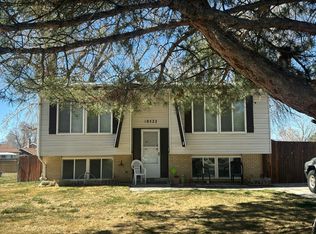
Lovely detached home, private yard, quiet street, this property could qualify for $100 down payment program. GREAT FOR THE KIDS TO PLAY OR ENTERTAINING WITH THE LARGE COVERED DECK. 4 BEDROOMS, 3 BATHS, NICE SIZE KITCHEN WITH KITCHEN, BAR AND SEMI FORMAL DINING, PLUS A COZY FIRPLACE FOR THOSE COLD WINTER NIGHTS.Eligible for 203 (k). You can live in this home for less than $900 per month.Good energy and natural light flow into every corner of this home. You'll be captivated with the warmth a fireplace gives and windows that let in lots of light! In the evening you can fire the fireplace & curl u
Pre-foreclosure
Est. $551,700
1371 E Sudbury Ave, Sandy, UT 84093
5beds
2,431sqft
SingleFamily
Built in 1972
10,018 Square Feet Lot
$-- Zestimate®
$227/sqft
$-- HOA
Overview
- 156 days |
- 1,101 |
- 45 |
Facts & features
Interior
Bedrooms & bathrooms
- Bedrooms: 5
- Bathrooms: 3
- Full bathrooms: 3
Heating
- Forced air, Other, Electric
Cooling
- Central
Appliances
- Included: Garbage disposal, Microwave, Range / Oven, Refrigerator
Features
- Flooring: Other
- Basement: Finished
- Has fireplace: Yes
Interior area
- Total interior livable area: 2,431 sqft
Property
Parking
- Total spaces: 5
- Parking features: Garage - Attached
Features
- Exterior features: Other
- Has view: Yes
- View description: Mountain
Lot
- Size: 10,018 Square Feet
Details
- Parcel number: 28041010320000
Construction
Type & style
- Home type: SingleFamily
Materials
- Frame
- Roof: Built-up
Condition
- Year built: 1972
Community & HOA
Location
- Region: Sandy
Financial & listing details
- Price per square foot: $227/sqft
- Tax assessed value: $551,700
- Annual tax amount: $2,943
Visit our professional directory to find a foreclosure specialist in your area that can help with your home search.
Find a foreclosure agentForeclosure details
Estimated market value
Not available
Estimated sales range
Not available
$4,003/mo
Price history
Price history
| Date | Event | Price |
|---|---|---|
| 3/8/2012 | Sold | -- |
Source: Agent Provided Report a problem | ||
| 1/8/2012 | Listed for sale | $145,000$60/sqft |
Source: Principal Realty Group-Utah #1061026 Report a problem | ||
| 11/6/2011 | Listing removed | $145,000$60/sqft |
Source: TITANIUM REAL ESTATE, PC #1061026 Report a problem | ||
| 10/26/2011 | Listed for sale | $145,000-12.7%$60/sqft |
Source: TITANIUM REAL ESTATE, PC #1061026 Report a problem | ||
| 9/9/2011 | Listing removed | $166,000$68/sqft |
Source: Realty Executives Experts #1002656 Report a problem | ||
| 8/13/2011 | Listed for sale | $166,000+18.7%$68/sqft |
Source: Realty Executives Experts #1002656 Report a problem | ||
| 7/1/2011 | Sold | -- |
Source: Public Record Report a problem | ||
| 1/29/2011 | Listing removed | $139,900$58/sqft |
Source: Realty Executives Experts #1002656 Report a problem | ||
| 1/5/2011 | Price change | $139,900-3.5%$58/sqft |
Source: Realty Executives Experts #1002656 Report a problem | ||
| 12/20/2010 | Price change | $145,000-6.5%$60/sqft |
Source: Realty Executives Experts #1002656 Report a problem | ||
| 12/5/2010 | Listed for sale | $155,000$64/sqft |
Source: Realty Executives Experts #1002656 Report a problem | ||
Public tax history
Public tax history
| Year | Property taxes | Tax assessment |
|---|---|---|
| 2024 | $2,943 -0.7% | $303,435 -0.5% |
| 2023 | $2,965 +6.2% | $305,085 +8% |
| 2022 | $2,791 +43.1% | $282,590 +68.1% |
| 2021 | $1,950 +1.9% | $168,080 +7.9% |
| 2020 | $1,914 +14% | $155,705 +16.8% |
| 2019 | $1,679 +2.6% | $133,265 +2.6% |
| 2018 | $1,636 -13.5% | $129,910 -43.7% |
| 2017 | $1,892 +0.9% | $230,700 -2.3% |
| 2016 | $1,875 -2.2% | $236,100 +18.2% |
| 2015 | $1,918 +9.9% | $199,800 +4.7% |
| 2014 | $1,746 | $190,800 +2.9% |
| 2013 | -- | $185,400 -5.8% |
| 2012 | -- | $196,800 -5.7% |
| 2011 | -- | $208,600 -1.5% |
| 2010 | -- | $211,700 -2.8% |
| 2009 | -- | $217,900 -7.3% |
| 2008 | $1,397 | $235,100 +6.4% |
| 2007 | -- | $220,900 +22.1% |
| 2006 | -- | $180,900 +13.3% |
| 2005 | -- | $159,600 +7.4% |
| 2002 | -- | $148,600 +8.2% |
| 2001 | -- | $137,400 +8.5% |
| 2000 | -- | $126,600 |
Find assessor info on the county website
Monthly payment
Estimated monthly payment
All calculations are estimates and provided by Zillow, Inc. for informational purposes only. Actual amounts may vary.
HOA fees may include property taxes on listings classified as Co-Ops. Contact the listing agent and/or owner for fee details.
Mortgage interest rates are dependent on a number of factors, including credit score, down payment, and repayment length. Interest rate data provided by Zillow Group Marketplace, Inc. as of 1/1/1970 from various mortgage lenders with which we have lead or other similar arrangements; the Estimated Payment is an average of those rates.
See how much you could borrow to make a competitive offer.
Climate risks
Neighborhood: 84093
Nearby schools
GreatSchools rating
- 8/10Peruvian Park SchoolGrades: K-5Distance: 0.4 mi
- 3/10Union Middle SchoolGrades: 6-8Distance: 1.5 mi
- 5/10Hillcrest High SchoolGrades: 8-12Distance: 1.9 mi
Schools provided by the listing agent
- Elementary: Peruvian Park
- Middle: Union
- High: Hillcrest
- District: Canyons
Source: The MLS. This data may not be complete. We recommend contacting the local school district to confirm school assignments for this home.

- Utah
- Salt Lake County
- Sandy
- 84093
- 1371 E Sudbury Ave
Nearby cities
Nearby zip codes
Other Sandy Topics
