This 2384 square foot single family home has 4 bedrooms and 2.0 bathrooms. This home is located at 1316 Raspberry Ct, Casselberry, FL 32707.
Pre-foreclosure
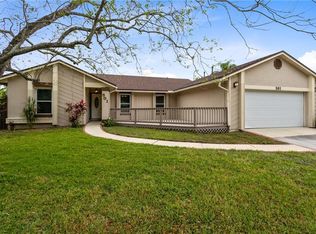
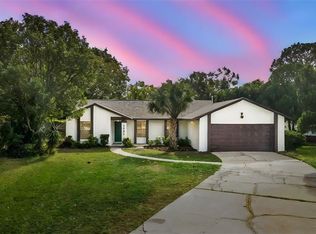
Street View
Est. $467,300
1316 Raspberry Ct, Casselberry, FL 32707
4beds
2baths
2,384sqft
SingleFamily
Built in 1982
0.26 Acres Lot
$467,300 Zestimate®
$196/sqft
$18/mo HOA
Overview
- 221 days |
- 21 |
- 0 |
Facts & features
Interior
Bedrooms & bathrooms
- Bedrooms: 4
- Bathrooms: 2
Heating
- Other, Solar
Cooling
- Central
Features
- Flooring: Other
Interior area
- Total interior livable area: 2,384 sqft
Property
Parking
- Parking features: Garage
Features
- Exterior features: Stucco, Cement / Concrete
Lot
- Size: 0.26 Acres
Details
- Parcel number: 1521305FX00000360
Construction
Type & style
- Home type: SingleFamily
Materials
- masonry
- Foundation: Footing
- Roof: Metal
Condition
- Year built: 1982
Community & HOA
HOA
- Has HOA: Yes
- HOA fee: $18 monthly
Location
- Region: Casselberry
Financial & listing details
- Price per square foot: $196/sqft
- Tax assessed value: $379,258
- Annual tax amount: $2,146
Visit our professional directory to find a foreclosure specialist in your area that can help with your home search.
Find a foreclosure agentForeclosure details
Estimated market value
$467,300
$439,000 - $495,000
$2,928/mo
Price history
Price history is unavailable.
Public tax history
| Year | Property taxes | Tax assessment |
|---|---|---|
| 2025 | $2,146 +30% | $169,765 +2.9% |
| 2024 | $1,651 +3.1% | $164,981 +3% |
| 2023 | $1,601 +3.2% | $160,176 +3% |
| 2022 | $1,551 -14.9% | $155,511 +3% |
| 2021 | $1,822 +1.4% | $150,982 +1.4% |
| 2020 | $1,798 +0.9% | $148,897 +2.3% |
| 2019 | $1,781 | $145,549 +1.9% |
| 2018 | $1,781 +1.5% | $142,835 +2.1% |
| 2017 | $1,756 +1.2% | $139,897 -26.9% |
| 2016 | $1,736 -43.6% | $191,380 +40.7% |
| 2015 | $3,080 | $136,068 +0.8% |
| 2014 | $3,080 +100.3% | $134,988 +1.5% |
| 2013 | $1,537 +7.5% | $132,993 +1.7% |
| 2012 | $1,430 -0.3% | $130,770 +0.7% |
| 2011 | $1,435 +1.1% | $129,910 +1.5% |
| 2010 | $1,420 +4.5% | $127,990 +2.7% |
| 2009 | $1,359 +3.7% | $124,625 -38.1% |
| 2008 | $1,311 -7.4% | $201,399 +66.6% |
| 2007 | $1,416 -5.5% | $120,874 +2.5% |
| 2006 | $1,498 +2.1% | $117,926 +3% |
| 2005 | $1,466 +0.7% | $114,491 +3% |
| 2004 | $1,456 +1% | $111,156 +1.9% |
| 2003 | $1,442 +6.9% | $109,083 +6.6% |
| 2002 | $1,348 +4.7% | $102,376 +4.6% |
| 2000 | $1,288 | $97,829 |
Find assessor info on the county website
Monthly payment
Estimated monthly payment$1,822
All calculations are estimates and provided by Zillow, Inc. for informational purposes only. Actual amounts may vary.
HOA fees may include property taxes on listings classified as Co-Ops. Contact the listing agent and/or owner for fee details.
Mortgage interest rates are dependent on a number of factors, including credit score, down payment, and repayment length. Interest rate data provided by Zillow Group Marketplace, Inc. as of 1/1/1970 from various mortgage lenders with which we have lead or other similar arrangements; the Estimated Payment is an average of those rates.
See how much you could borrow to make a competitive offer.
Climate risks
Neighborhood: 32707
Getting around
12 / 100
Minimal TransitNearby schools
GreatSchools rating
- 6/10Sterling Park Elementary SchoolGrades: PK-5Distance: 0.4 mi
- NAA Seminole County Virtual SchoolGrades: K-12Distance: 6.5 mi
- 7/10Lake Howell High SchoolGrades: 9-12Distance: 2.5 mi


- Florida
- Seminole County
- Casselberry
- 32707
- 1316 Raspberry Ct
Nearby cities
Nearby zip codes
Other Casselberry Topics
