$469,500
3 bd|2 ba|2.2k sqft
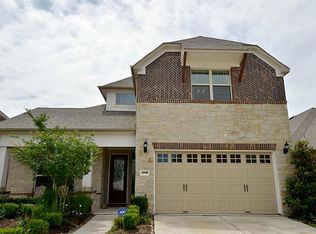
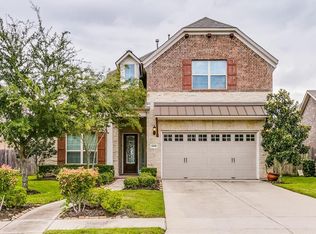
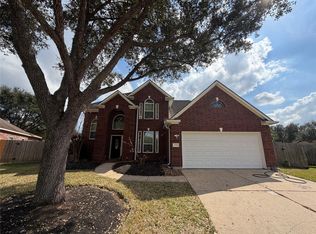
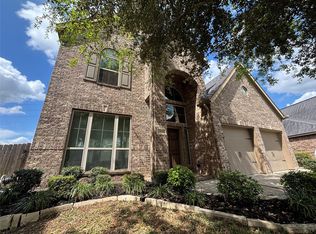
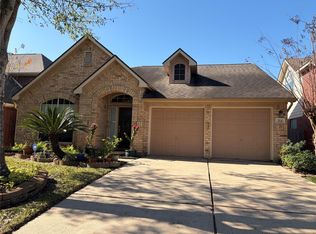
1327 Ralston Branch Way, Sugar Land, TX 77479
Off Market
Likely to sell faster than
Zillow last checked:
Listing updated:
Yan Liu TREC #0682216 281-223-2885,
KingFay Inc
$491,200
$467,000 - $516,000
$2,802/mo
| Date | Event | Price |
|---|---|---|
| 5/21/2026 | Listed for sale | $498,000-2%$183/sqft |
Source: | ||
| 5/21/2026 | Listing removed | $508,000$187/sqft |
Source: | ||
| 5/11/2026 | Price change | $508,000-1.9%$187/sqft |
Source: | ||
| 4/21/2026 | Listed for sale | $518,000+15.1%$191/sqft |
Source: | ||
| 3/20/2022 | Listing removed | -- |
Source: | ||
| 2/8/2022 | Pending sale | $450,000$166/sqft |
Source: | ||
| 2/3/2022 | Listed for sale | $450,000$166/sqft |
Source: | ||
| 12/1/2018 | Listing removed | $2,400$1/sqft |
Source: Coldwell Banker United, Realtors - Sugar Land #88503484 Report a problem | ||
| 10/20/2018 | Price change | $2,400-4%$1/sqft |
Source: Coldwell Banker United, Realtors - Sugar Land #88503484 Report a problem | ||
| 8/28/2018 | Price change | $2,500-3.8%$1/sqft |
Source: Coldwell Banker United, Realtors - Sugar Land #88503484 Report a problem | ||
| 2/25/2018 | Price change | $2,600-8.8%$1/sqft |
Source: REALM Real Estate Professional #76435402 Report a problem | ||
| 2/7/2018 | Listed for rent | $2,850+5.6%$1/sqft |
Source: REALM Real Estate Professional #76435402 Report a problem | ||
| 8/31/2015 | Listing removed | $2,700$1/sqft |
Source: REALM PROFESSIONALS Report a problem | ||
| 7/24/2015 | Price change | $2,700-6.9%$1/sqft |
Source: Realm Real Estate Professional #39064407 Report a problem | ||
| 6/10/2015 | Listed for rent | $2,900+7.4%$1/sqft |
Source: Realm Real Estate Professional #39064407 Report a problem | ||
| 4/12/2014 | Listing removed | $2,700$1/sqft |
Source: Realm Real Estate Professional #26724862 Report a problem | ||
| 4/5/2014 | Listed for rent | $2,700$1/sqft |
Source: Realm Real Estate Professional #26724862 Report a problem | ||
| Year | Property taxes | Tax assessment |
|---|---|---|
| 2025 | -- | $558,138 +4.8% |
| 2024 | $7,667 -11.3% | $532,633 +9.6% |
| 2023 | $8,645 +16% | $486,194 +13.4% |
| 2022 | $7,455 -1.7% | $428,590 +13.6% |
| 2021 | $7,581 +0.3% | $377,300 +1.3% |
| 2020 | $7,562 -1.5% | $372,550 +0.1% |
| 2019 | $7,675 -4.7% | $372,190 -2.9% |
| 2018 | $8,057 -33.1% | $383,370 +2% |
| 2017 | $12,048 | $375,750 -2.9% |
| 2016 | $12,048 +52.8% | $386,780 +5.1% |
| 2015 | $7,884 +32.1% | $368,070 +21.1% |
| 2014 | $5,970 | $304,040 +10% |
| 2013 | -- | $276,400 -1.9% |
| 2012 | -- | $281,760 -4.1% |
| 2011 | -- | $293,890 +528.6% |
| 2010 | -- | $46,750 |
Find assessor info on the county website
Source: HAR. This data may not be complete. We recommend contacting the local school district to confirm school assignments for this home.
A local agent can set up tours, give advice and negotiate with sellers.