$676,200
4 bd|3 ba|2.8k sqft
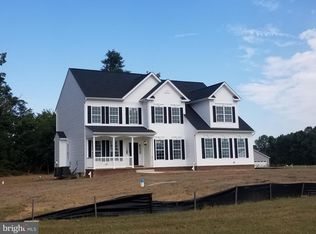
14005 Mill Spring Ct, Bryantown, MD 20617
Off Market
Zillow last checked:
Listing updated:
Anna Jones 240-441-3298,
Real Broker, LLC 8504500442
$509,900
$479,000 - $540,000
$3,273/mo
| Date | Event | Price |
|---|---|---|
| 6/4/2026 | Listed for sale | $375,000+4.7%$140/sqft |
Source: | ||
| 3/24/2021 | Listing removed | -- |
Source: Owner Report a problem | ||
| 12/2/2020 | Sold | $358,000-5.3%$133/sqft |
Source: Public Record Report a problem | ||
| 7/30/2020 | Listed for sale | $377,900+243.5%$141/sqft |
Source: Owner Report a problem | ||
| 1/17/2020 | Sold | $110,000-10.7%$41/sqft |
Source: EXIT Realty solds #-547428579172557666 Report a problem | ||
| 1/2/2020 | Pending sale | $123,200$46/sqft |
Source: Long & Foster Real Estate, Inc. #MDCH100009 Report a problem | ||
| 12/12/2019 | Price change | $123,200-10%$46/sqft |
Source: Long & Foster Real Estate, Inc. #MDCH100009 Report a problem | ||
| 11/17/2019 | Price change | $136,900-9.9%$51/sqft |
Source: Long & Foster Real Estate, Inc. #MDCH100009 Report a problem | ||
| 10/21/2019 | Price change | $152,000-10%$57/sqft |
Source: Long & Foster Real Estate, Inc. #MDCH100009 Report a problem | ||
| 9/27/2019 | Price change | $168,900-9.9%$63/sqft |
Source: Long & Foster Real Estate, Inc. #MDCH100009 Report a problem | ||
| 8/27/2019 | Price change | $187,500-9.9%$70/sqft |
Source: Long & Foster Real Estate, Inc. #MDCH100009 Report a problem | ||
| 7/31/2019 | Listed for sale | $208,100-7.6%$77/sqft |
Source: Long & Foster Real Estate, Inc. #MDCH100009 Report a problem | ||
| 3/21/2019 | Sold | $225,250$84/sqft |
Source: Public Record Report a problem | ||
| Year | Property taxes | Tax assessment |
|---|---|---|
| 2025 | $6,526 +7.9% | $461,167 +8% |
| 2024 | $6,049 +22.8% | $427,133 +8.7% |
| 2023 | $4,926 +27.3% | $393,100 |
| 2022 | $3,869 +2% | $393,100 +29.8% |
| 2021 | $3,794 +17.5% | $302,767 +17.5% |
| 2020 | $3,228 -1% | $257,600 |
| 2019 | $3,260 +4.2% | $257,600 +8.5% |
| 2018 | $3,127 +4.4% | $237,467 +4.4% |
| 2017 | $2,995 +709.3% | $227,400 |
| 2016 | $370 | $227,400 |
| 2015 | $370 | $227,400 -13.9% |
| 2014 | $370 | $264,100 |
| 2013 | -- | $264,100 |
| 2012 | -- | $264,100 -11.5% |
| 2011 | -- | $298,550 |
| 2010 | -- | $298,550 |
| 2009 | -- | $298,550 -1.3% |
| 2008 | -- | $302,400 +16.6% |
| 2007 | -- | $259,396 +19.9% |
| 2006 | -- | $216,393 +24.8% |
| 2005 | -- | $173,390 +3.3% |
| 2004 | -- | $167,832 +3.4% |
| 2003 | -- | $162,276 +3.5% |
| 2002 | -- | $156,720 +1.1% |
| 2001 | -- | $154,992 |
Find assessor info on the county website
Source: Bright MLS. This data may not be complete. We recommend contacting the local school district to confirm school assignments for this home.
A local agent can set up tours, give advice and negotiate with sellers.


