$364,700
-- bd|2 ba|1.9k sqft
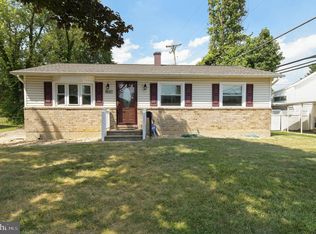
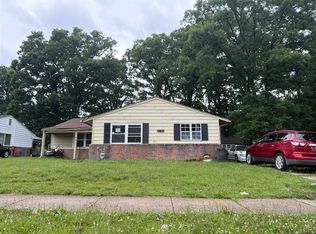
737 Crosby Rd, Catonsville, MD 21228
Off Market
Zillow last checked:
Listing updated:
Jimy Chavarria 410-908-0699,
Keller Williams Gateway LLC (443) 318-8800
$511,200
$486,000 - $537,000
$2,989/mo
| Date | Event | Price |
|---|---|---|
| 6/24/2026 | Pending sale | $500,000$262/sqft |
Source: | ||
| 6/22/2026 | Listed for sale | $500,000+66.7%$262/sqft |
Source: | ||
| 2/27/2026 | Sold | $300,000$157/sqft |
Source: Public Record Report a problem | ||
| 1/26/2022 | Sold | $300,000$157/sqft |
Source: Public Record Report a problem | ||
| 11/19/2021 | Sold | $300,000-14.3%$157/sqft |
Source: | ||
| 9/26/2021 | Pending sale | $350,000$183/sqft |
Source: | ||
| 9/25/2021 | Contingent | $350,000$183/sqft |
Source: | ||
| 9/11/2021 | Listed for sale | $350,000+67.5%$183/sqft |
Source: | ||
| 7/28/2016 | Listing removed | $209,000$110/sqft |
Source: Keller Williams Excellence #BC9721187 Report a problem | ||
| 7/22/2016 | Listed for sale | $209,000-12.9%$110/sqft |
Source: Keller Williams Excellence #BC9721187 Report a problem | ||
| 1/21/2011 | Listing removed | $240,000$126/sqft |
Source: Long & Foster Real Estate Inc. #BC7340876 Report a problem | ||
| 10/5/2010 | Pending sale | $240,000$126/sqft |
Source: Long & Foster Real Estate #BC7340876 Report a problem | ||
| 8/7/2010 | Price change | $240,000-7.7%$126/sqft |
Source: Long & Foster Real Estate #BC7340876 Report a problem | ||
| 5/20/2010 | Listed for sale | $260,000+126.1%$136/sqft |
Source: Long & Foster Real Estate, Inc. #BC7340876 Report a problem | ||
| 9/2/1997 | Sold | $115,000$60/sqft |
Source: Public Record Report a problem | ||
| Year | Property taxes | Tax assessment |
|---|---|---|
| 2025 | $6,530 +82% | $326,000 +10.1% |
| 2024 | $3,588 +5.1% | $296,000 +5.1% |
| 2023 | $3,415 +5.3% | $281,733 -4.8% |
| 2022 | $3,242 +5.6% | $296,000 +16.9% |
| 2021 | $3,069 +2.1% | $253,200 +2.1% |
| 2020 | $3,005 +2.2% | $247,967 -2.1% |
| 2019 | $2,942 +2.2% | $253,200 +6.6% |
| 2018 | $2,879 +4.4% | $237,500 +4.4% |
| 2017 | $2,758 +1% | $227,567 +4.6% |
| 2016 | $2,730 | $217,633 +4.8% |
| 2015 | $2,730 | $207,700 |
| 2014 | $2,730 | $207,700 |
| 2013 | -- | $207,700 -17.4% |
| 2012 | -- | $251,500 |
| 2011 | -- | $251,500 |
| 2010 | -- | $251,500 -19.6% |
| 2009 | -- | $312,640 +18.2% |
| 2008 | -- | $264,460 +22.3% |
| 2007 | -- | $216,280 +28.7% |
| 2006 | -- | $168,100 +7.2% |
| 2005 | -- | $156,812 +7.8% |
| 2004 | -- | $145,526 +8.4% |
| 2003 | -- | $134,240 +2.4% |
| 2002 | -- | $131,032 +2.5% |
| 2001 | -- | $127,826 |
Find assessor info on the county website
Source: Bright MLS. This data may not be complete. We recommend contacting the local school district to confirm school assignments for this home.
A local agent can set up tours, give advice and negotiate with sellers.