$--
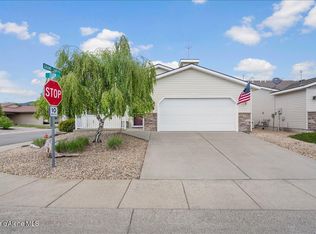
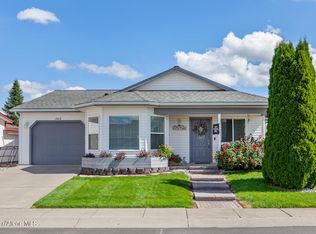
3 bd|2 ba|1.5k sqft
13618 N Kings Canyon Rd, Rathdrum, ID 83858
Sold
Likely to sell faster than
Zillow last checked:
Listing updated:
Angie Piazzola 208-263-4540,
Inland Northwest Realty
$236,400
$225,000 - $248,000
$2,321/mo
| Date | Event | Price |
|---|---|---|
| 4/23/2026 | Price change | $239,900-4%$185/sqft |
Source: | ||
| 3/4/2026 | Listed for sale | $249,900+13.6%$193/sqft |
Source: | ||
| 4/1/2025 | Listing removed | $220,000$170/sqft |
Source: | ||
| 3/17/2025 | Listed for sale | $220,000+22.2%$170/sqft |
Source: | ||
| 12/9/2024 | Contingent | $180,000$139/sqft |
Source: | ||
| 12/7/2024 | Listed for sale | $180,000$139/sqft |
Source: | ||
| 10/7/2024 | Listing removed | $180,000$139/sqft |
Source: | ||
| 9/30/2024 | Price change | $180,000-14.3%$139/sqft |
Source: | ||
| 9/24/2024 | Price change | $210,000-4.5%$162/sqft |
Source: | ||
| 9/4/2024 | Price change | $220,000-3.7%$170/sqft |
Source: | ||
| 8/28/2024 | Price change | $228,500-2.8%$176/sqft |
Source: | ||
| 8/20/2024 | Price change | $235,000-5.1%$181/sqft |
Source: | ||
| 5/31/2024 | Listed for sale | $247,500-17.5%$191/sqft |
Source: | ||
| 1/1/2024 | Listing removed | -- |
Source: | ||
| 6/5/2023 | Price change | $299,900-7.7%$231/sqft |
Source: | ||
| 5/19/2023 | Price change | $325,000-3%$251/sqft |
Source: | ||
| 4/17/2023 | Listed for sale | $335,000$258/sqft |
Source: | ||
| 4/15/2023 | Listing removed | -- |
Source: | ||
| 3/15/2023 | Price change | $335,000-3.6%$258/sqft |
Source: | ||
| 2/9/2023 | Price change | $347,500-3.4%$268/sqft |
Source: | ||
| 1/18/2023 | Price change | $359,900-4%$278/sqft |
Source: | ||
| 11/9/2022 | Price change | $375,000-2.6%$289/sqft |
Source: | ||
| 10/15/2022 | Listed for sale | $385,000$297/sqft |
Source: | ||
| 1/27/2022 | Listing removed | -- |
Source: | ||
| Year | Property taxes | Tax assessment |
|---|---|---|
| 2025 | $1,610 -9.8% | $274,140 -4.1% |
| 2024 | $1,785 +83.8% | $285,901 +50% |
| 2023 | $971 -18.4% | $190,634 +1% |
| 2022 | $1,191 -42% | $188,794 -11.1% |
| 2021 | $2,054 +861.6% | $212,296 +17.3% |
| 2020 | $214 +359.2% | $181,058 +6.6% |
| 2019 | $47 -78.2% | $169,913 +17.9% |
| 2018 | $214 +359.3% | $144,066 |
| 2017 | $47 +100% | -- |
| 2016 | $23 | -- |
| 2015 | $23 | $134,138 +16.6% |
| 2013 | $23 | $115,030 -2.7% |
| 2011 | -- | $118,180 -0.5% |
| 2010 | -- | $118,745 |
Find assessor info on the county website
A local agent can set up tours, give advice and negotiate with sellers.