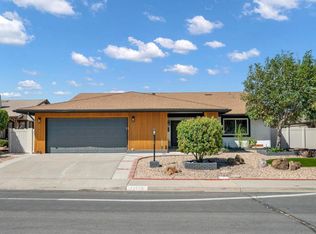
Welcome to your dream home nestled in an unbeatable Poway neighborhood! This turnkey property offers the perfect blend of low-maintenance luxury & pristine comfort. Offering 4 bedrooms & 2 bathrooms, this meticulously kept residence welcomes you with a refreshed kitchen & bathrooms, ensuring both style and functionality. The heart of the home features a living space for gatherings or quiet evenings. Indulge in the custom-designed bathrooms, elegant tile design, and contemporary fittings create an experience that you'll enjoy. Don't miss your chance to own this exceptional property - a true masterpiece waiting to be embraced.
For sale
Listed by: Rise Realty • Ravneet Pahwa • Contact: Sales@XLNCEXOTIC.com
$1,099,000
13824 Powers Rd, Poway, CA 92064
4beds
1,288sqft
Single Family Residence
Built in 1959
7,000 Square Feet Lot
$-- Zestimate®
$853/sqft
$-- HOA
What's special
- 11 days
- 323
- 29
Likely to sell faster than
Zillow last checked:
Listing updated:
Listed by:
Ravneet Pahwa DRE #02214425 Sales@XLNCEXOTIC.com,
Rise Realty
Source: CRMLS,MLS#: NDP2609608 Originating MLS: California Regional MLS (North San Diego County & Pacific Southwest AORs)
Facts & features
Interior
Bedrooms & bathrooms
- Bedrooms: 4
- Bathrooms: 2
- Full bathrooms: 2
Rooms
- Room types: Bedroom
Bedroom
- Features: All Bedrooms Down
Cooling
- Central Air, Wall/Window Unit(s)
Appliances
- Laundry: Electric Dryer Hookup, Gas Dryer Hookup, In Garage
Features
- All Bedrooms Down
- Has fireplace: Yes
- Fireplace features: Living Room
- Common walls with other units/homes: No Common Walls
Interior area
- Total interior livable area: 1,288 sqft
Video & virtual tour
Property
Parking
- Total spaces: 5
- Parking features: Garage - Attached
- Attached garage spaces: 2
- Uncovered spaces: 3
Features
- Levels: One
- Stories: 1
- Entry location: Ground Level
- Pool features: None
Lot
- Size: 7,000 Square Feet
- Features: 0-1 Unit/Acre
Details
- Parcel number: 3141550500
- Zoning: RS1
- Special conditions: Standard
Construction
Type & style
- Home type: SingleFamily
- Property subtype: Single Family Residence
Condition
- Year built: 1959
Utilities & green energy
- Sewer: Public Sewer
Community & HOA
Community
- Features: Urban
Location
- Region: Poway
Financial & listing details
- Price per square foot: $853/sqft
- Tax assessed value: $856,799
- Date on market: 10/16/2026
- Listing terms: Cash,Cash to Existing Loan,Cash to New Loan,Conventional,Contract,Cal Vet Loan,1031 Exchange,FHA 203(b),FHA 203(k),FHA,Fannie Mae,Freddie Mac,Government Loan,Lease Option,Submit
- Inclusions: This property comes with the SunRun Solar lease.
Estimated market value
Not available
Estimated sales range
Not available
Not available
Price history
| Date | Event | Price |
|---|---|---|
| 10/16/2026 | Listed for sale | $1,099,000+30.8%$853/sqft |
Source:  CRMLS #NDP2609608 Report a problem | ||
| 7/29/2026 | Listing removed | $15,093$12/sqft |
Source: Zillow Rentals Report a problem | ||
| 7/28/2026 | Price change | $15,093+1.2%$12/sqft |
Source: Zillow Rentals Report a problem | ||
| 7/26/2026 | Price change | $14,912-3.3%$12/sqft |
Source: Zillow Rentals Report a problem | ||
| 7/24/2026 | Price change | $15,428-6.4%$12/sqft |
Source: Zillow Rentals Report a problem | ||
| 7/23/2026 | Price change | $16,480+0.3%$13/sqft |
Source: Zillow Rentals Report a problem | ||
| 7/22/2026 | Price change | $16,437-0.3%$13/sqft |
Source: Zillow Rentals Report a problem | ||
| 7/20/2026 | Price change | $16,482+0.2%$13/sqft |
Source: Zillow Rentals Report a problem | ||
| 7/19/2026 | Price change | $16,446-2.6%$13/sqft |
Source: Zillow Rentals Report a problem | ||
| 7/17/2026 | Price change | $16,878-0.3%$13/sqft |
Source: Zillow Rentals Report a problem | ||
| 7/15/2026 | Price change | $16,9220%$13/sqft |
Source: Zillow Rentals Report a problem | ||
| 7/13/2026 | Price change | $16,923+0.3%$13/sqft |
Source: Zillow Rentals Report a problem | ||
| 7/11/2026 | Price change | $16,869+21.6%$13/sqft |
Source: Zillow Rentals Report a problem | ||
| 7/10/2026 | Price change | $13,871+0.4%$11/sqft |
Source: Zillow Rentals Report a problem | ||
| 7/8/2026 | Price change | $13,818-1.1%$11/sqft |
Source: Zillow Rentals Report a problem | ||
| 7/7/2026 | Price change | $13,975-0.6%$11/sqft |
Source: Zillow Rentals Report a problem | ||
| 7/4/2026 | Price change | $14,053+2.6%$11/sqft |
Source: Zillow Rentals Report a problem | ||
| 6/30/2026 | Price change | $13,699-13.7%$11/sqft |
Source: Zillow Rentals Report a problem | ||
| 6/27/2026 | Price change | $15,869+16.6%$12/sqft |
Source: Zillow Rentals Report a problem | ||
| 6/21/2026 | Price change | $13,611-0.9%$11/sqft |
Source: Zillow Rentals Report a problem | ||
| 6/20/2026 | Price change | $13,728-2.5%$11/sqft |
Source: Zillow Rentals Report a problem | ||
| 6/18/2026 | Price change | $14,086+0.5%$11/sqft |
Source: Zillow Rentals Report a problem | ||
| 6/16/2026 | Price change | $14,009-0.1%$11/sqft |
Source: Zillow Rentals Report a problem | ||
| 6/14/2026 | Price change | $14,021+0.5%$11/sqft |
Source: Zillow Rentals Report a problem | ||
| 6/10/2026 | Listed for rent | $13,946$11/sqft |
Source: Zillow Rentals Report a problem | ||
| 10/11/2024 | Sold | $840,000+62.5%$652/sqft |
Source:  SDMLS #240017395 Report a problem | ||
| 3/13/2017 | Sold | $517,000+52.1%$401/sqft |
Source: Public Record Report a problem | ||
| 7/6/2009 | Sold | $340,000-15.6%$264/sqft |
Source: Public Record Report a problem | ||
| 4/6/2007 | Sold | $403,000-3.8%$313/sqft |
Source: Public Record Report a problem | ||
| 11/7/2006 | Sold | $419,125$325/sqft |
Source: Public Record Report a problem | ||
Public tax history
| Year | Property taxes | Tax assessment |
|---|---|---|
| 2026 | -- | $856,799 +2% |
| 2025 | $9,580 +44.8% | $840,000 +42.8% |
| 2024 | $6,614 +2.2% | $588,138 +2% |
| 2023 | $6,473 +1.7% | $576,607 +2% |
| 2022 | $6,365 +1.3% | $565,302 +2% |
| 2021 | $6,281 +1.4% | $554,218 +1% |
| 2020 | $6,197 +4.4% | $548,536 +2% |
| 2019 | $5,936 -0.1% | $537,781 +2% |
| 2018 | $5,943 +42.1% | $527,237 +39.4% |
| 2017 | $4,182 +2.1% | $378,147 +2% |
| 2016 | $4,096 +1.5% | $370,734 +1.5% |
| 2015 | $4,035 +2.4% | $365,167 +2% |
| 2014 | $3,940 | $358,015 +0.5% |
| 2013 | -- | $356,398 +2% |
| 2012 | -- | $349,411 +2% |
| 2011 | -- | $342,560 +0.8% |
| 2010 | -- | $340,000 +13.3% |
| 2009 | -- | $300,000 -25.5% |
| 2008 | -- | $402,900 -2.9% |
| 2007 | -- | $415,000 +131.9% |
| 2006 | -- | $178,965 +2% |
| 2005 | -- | $175,457 +2% |
| 2004 | -- | $172,017 +1.9% |
| 2003 | -- | $168,865 +2% |
| 2002 | -- | $165,554 +2% |
| 2001 | -- | $162,309 |
Find assessor info on the county website
Monthly payment
Est. payment
Payment breakdown
Explore the cost of this home by adjusting the details. Changes won't be saved.Climate risks
Neighborhood: 92064


Similar homes
- $1,350,0004 bd2 ba1.7k sqft12311 Witt Rd, Poway, CA 92064For Sale
 MLS ID #NDP2609020, Ravneet Pahwa, Rise Realty. CRMLS
- $1,099,0003 bd2 ba1.7k sqft12576 Lomica Dr, San Diego, CA 92128For Sale
 MLS ID #PTP2606516, Christopher Nicholson, Heritage Re David Waitley Co B. CRMLS
- $1,285,0004 bd2 ba1.7k sqft11170 Briarcliff Dr, San Diego, CA 92131For Sale
 MLS ID #NDP2608430, Peter San Nicolas, Peter San Nicolas, Broker. CRMLS
- $1,249,9994 bd3 ba1.8k sqftHigh Country West, San Diego, CA 92127For Sale
 MLS ID #260024015, Alexandra D Marikos, The Oppenheim Group. SDMLS
