Cash/Creative. Sub-To existing liens w/ exclusions. Quick close. Property can be shown with advanced notice.
For sale by owner
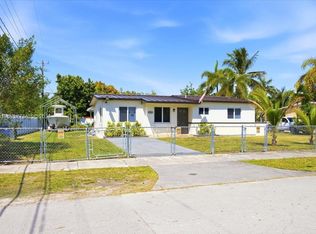
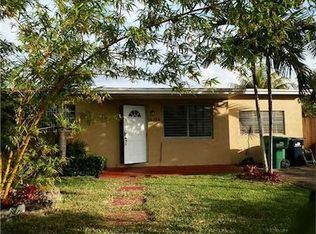
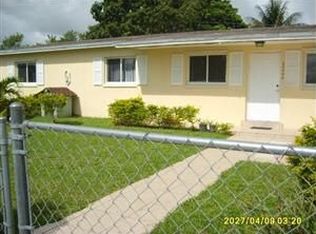
Street View
$440,000
14385 SW 285th St, Homestead, FL 33033
4beds
1,276sqft
SingleFamily
Built in 1962
9,975 Square Feet Lot
$-- Zestimate®
$345/sqft
$-- HOA
Overview
- 33 days |
- 214 |
- 9 |
Listed by:
Property Owner (305) 501-0997
Facts & features
Interior
Bedrooms & bathrooms
- Bedrooms: 4
- Bathrooms: 3
- Full bathrooms: 2
- 1/2 bathrooms: 1
Cooling
- Central
Appliances
- Included: Dishwasher, Dryer, Microwave, Range / Oven, Refrigerator, Washer
Features
- Flooring: Tile
- Basement: None
Interior area
- Total interior livable area: 1,276 sqft
Property
Parking
- Parking features: Carport, Off-street, On-street
Features
- Exterior features: Cement / Concrete
Lot
- Size: 9,975 Square Feet
Details
- Parcel number: 3079030030310
Construction
Type & style
- Home type: SingleFamily
Materials
- concrete
- Roof: Other
Condition
- New construction: No
- Year built: 1962
Community & HOA
Location
- Region: Homestead
Financial & listing details
- Price per square foot: $345/sqft
- Tax assessed value: $367,813
- Annual tax amount: $2,634
- Date on market: 5/5/2026
Estimated market value
Not available
Estimated sales range
Not available
$2,947/mo
Price history
| Date | Event | Price |
|---|---|---|
| 6/5/2026 | Listed for sale | $440,000-1.1%$345/sqft |
Source: Owner Report a problem | ||
| 5/7/2026 | Listing removed | -- |
Source: Owner Report a problem | ||
| 5/5/2026 | Listed for sale | $445,000+680.7%$349/sqft |
Source: Owner Report a problem | ||
| 2/27/2012 | Sold | $57,000+42.5%$45/sqft |
Source: Public Record Report a problem | ||
| 9/20/2011 | Sold | $40,000-35.5%$31/sqft |
Source: Public Record Report a problem | ||
| 4/23/2011 | Price change | $62,000-3.1%$49/sqft |
Source: Castle Realty #M1456177 Report a problem | ||
| 4/13/2011 | Price change | $64,000-7.9%$50/sqft |
Source: Castle Realty #M1456177 Report a problem | ||
| 3/16/2011 | Price change | $69,500-6%$54/sqft |
Source: Castle Realty #M1456177 Report a problem | ||
| 2/5/2011 | Price change | $73,900-7.5%$58/sqft |
Source: Castle Realty #M1456177 Report a problem | ||
| 1/2/2011 | Price change | $79,900+115.9%$63/sqft |
Source: Castle Realty #M1456177 Report a problem | ||
| 1/1/2011 | Listed for sale | -- |
Source: foreclosure.com Report a problem | ||
| 10/8/2010 | Sold | $37,000-65.6%$29/sqft |
Source: Public Record Report a problem | ||
| 4/10/2003 | Sold | $107,500+60.4%$84/sqft |
Source: Public Record Report a problem | ||
| 11/23/1999 | Sold | $67,000$53/sqft |
Source: Public Record Report a problem | ||
Public tax history
| Year | Property taxes | Tax assessment |
|---|---|---|
| 2025 | $2,634 +2.7% | $154,767 +2.9% |
| 2024 | $2,564 +9% | $150,406 +3% |
| 2023 | $2,352 +5.1% | $146,026 +3% |
| 2022 | $2,238 +1.6% | $141,773 +3% |
| 2021 | $2,202 +1.2% | $137,644 +1.4% |
| 2020 | $2,176 -23.8% | $135,744 +23.6% |
| 2019 | $2,857 +10.2% | $109,809 +10% |
| 2018 | $2,592 | $99,827 +10% |
| 2017 | $2,592 +12.2% | $90,752 +10% |
| 2016 | $2,310 +22.3% | $82,502 +10% |
| 2015 | $1,888 +9.8% | $75,002 +10% |
| 2014 | $1,719 +26% | $68,184 +10% |
| 2013 | $1,365 | $61,986 +23.9% |
| 2012 | $1,365 -18.4% | $50,009 -24.1% |
| 2011 | $1,673 +57.9% | $65,928 +4.3% |
| 2010 | $1,059 -51.2% | $63,207 -51.8% |
| 2009 | $2,173 -7% | $131,199 +28.3% |
| 2007 | $2,338 +3.1% | $102,251 |
| 2006 | $2,268 | -- |
| 2005 | $2,268 +2.1% | -- |
| 2004 | $2,220 +79.1% | -- |
| 2003 | $1,239 -26.2% | -- |
| 2002 | $1,680 | -- |
| 2001 | $1,680 | -- |
Find assessor info on the county website
Monthly payment
Est. payment$--/mo
Payment breakdown
Explore the cost of this home by adjusting the details. Changes won't be saved.
All calculations are estimates and provided by Zillow, Inc. for informational purposes only. Actual amounts may vary.
HOA fees may include property taxes on listings classified as Co-Ops. Contact the listing agent and/or owner for fee details.
Mortgage interest rates are dependent on a number of factors, including credit score, down payment, and repayment length. Interest rate data provided by Zillow Group Marketplace, Inc. as of 1/1/1970 from various mortgage lenders with which we have lead or other similar arrangements; the Estimated Payment is an average of those rates.
See how much you could borrow to make a competitive offer.
Climate risks
Neighborhood: Leisure City
Nearby schools
GreatSchools rating
- 5/10Mandarin Lakes K-8 AcademyGrades: PK-8Distance: 2.2 mi
- 3/10Homestead Senior High SchoolGrades: PK,9-12Distance: 4.3 mi
- 5/10Redland Middle SchoolGrades: 6-8Distance: 2.9 mi
A local agent can set up tours, give advice and negotiate with sellers.


- Florida
- Miami-Dade County
- Homestead
- 33033
- Leisure City
- 14385 SW 285th St
Nearby cities
Nearby neighborhoods
Nearby zip codes
Other Homestead Topics
