$7,910
-- bd|-- ba|-- sqft
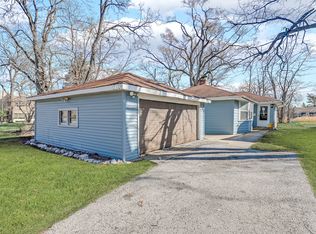
16826 Orchard Ridge Ave, Hazel Crest, IL 60429
Off Market
Likely to sell faster than
Zillow last checked:
Listing updated:
Maria Hatter 708-264-4589,
Better Homes & Gardens Real Estate
Not available
Estimated sales range
Not available
Not available
| Date | Event | Price |
|---|---|---|
| 4/11/2026 | Pending sale | $205,000$146/sqft |
Source: | ||
| 3/29/2026 | Listed for sale | $205,000+101%$146/sqft |
Source: | ||
| 12/2/2025 | Sold | $102,000-18.4%$73/sqft |
Source: | ||
| 11/4/2025 | Contingent | $125,000$89/sqft |
Source: | ||
| 10/26/2025 | Price change | $125,000-10.7%$89/sqft |
Source: | ||
| 10/13/2025 | Price change | $140,000-6.7%$100/sqft |
Source: | ||
| 10/1/2025 | Listed for sale | $150,000$107/sqft |
Source: | ||
| 9/7/2025 | Listing removed | $150,000$107/sqft |
Source: | ||
| 7/24/2025 | Listed for sale | $150,000-9.1%$107/sqft |
Source: | ||
| 7/23/2025 | Listing removed | $165,000$118/sqft |
Source: | ||
| 6/10/2025 | Listed for sale | $165,000$118/sqft |
Source: | ||
| 3/14/2025 | Contingent | $165,000$118/sqft |
Source: | ||
| 1/14/2025 | Listed for sale | $165,000+184.5%$118/sqft |
Source: | ||
| 2/8/2023 | Listing removed | -- |
Source: Zillow Rentals Report a problem | ||
| 2/3/2023 | Listed for rent | $2,300$2/sqft |
Source: Zillow Rentals Report a problem | ||
| 1/15/2019 | Sold | $58,000-10.6%$41/sqft |
Source: | ||
| 12/19/2018 | Pending sale | $64,900$46/sqft |
Source: RE/MAX "10" In The Park #10147500 Report a problem | ||
| 12/1/2018 | Listed for sale | $64,900$46/sqft |
Source: RE/MAX 10 in the Park #10147500 Report a problem | ||
| Year | Property taxes | Tax assessment |
|---|---|---|
| 2023 | $4,291 +23.4% | $6,700 +66.7% |
| 2022 | $3,478 +2.9% | $4,018 |
| 2021 | $3,381 -57.5% | $4,018 -60.2% |
| 2020 | $7,958 | $10,087 +85.8% |
| 2019 | -- | $5,430 |
| 2018 | -- | $5,430 |
| 2017 | -- | $5,430 +5% |
| 2016 | $601 | $5,170 |
| 2015 | -- | $5,170 |
| 2014 | -- | $5,170 -10.2% |
| 2013 | -- | $5,756 |
| 2012 | -- | $5,756 |
| 2011 | $35 +25.7% | $5,756 -29.7% |
| 2010 | $28 +6.3% | $8,192 |
| 2009 | $26 -70.7% | $8,192 -5% |
| 2008 | $90 -59.8% | $8,624 +11.8% |
| 2007 | $223 -82.7% | $7,711 |
| 2006 | $1,287 +7.1% | $7,711 |
| 2005 | $1,202 -1.2% | $7,711 +20.2% |
| 2004 | $1,217 -4.1% | $6,414 |
| 2003 | $1,268 +0.5% | $6,414 |
| 2002 | $1,262 +54.8% | $6,414 +9.6% |
| 2001 | $816 +1.4% | $5,852 |
| 2000 | $804 | $5,852 |
| 1999 | $804 | $5,852 |
Find assessor info on the county website
Source: MRED as distributed by MLS GRID. This data may not be complete. We recommend contacting the local school district to confirm school assignments for this home.
A local agent can set up tours, give advice and negotiate with sellers.