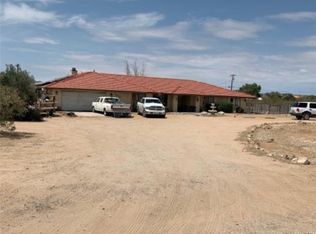
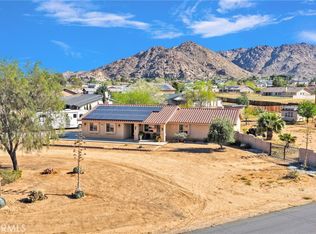
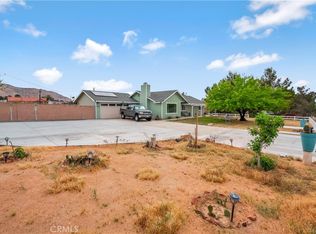
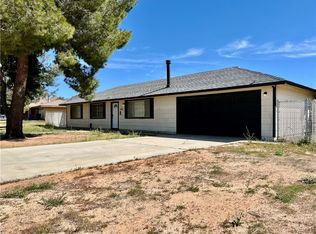
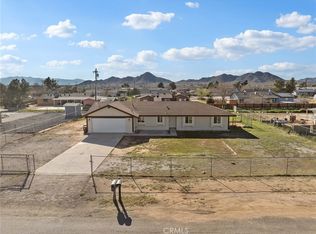
Located in Apple Valley's Sycamore Rocks, this home features, new carpet and paint and appliances. The floorplan includes a formal dining room and living room and a family room with a beautiful corner brick fireplace. There is also a very large bonus room off the kitchen. Bring your animals and toys and RV's, this lot is over an acre with a great view. Hurry and call today Brokered And Advertised By: Exit Realty Blaine & Associate Listing Agent: Beverly Bower
Pre-foreclosure
Street View
Est. $421,900
16873 Mesquite Rd, Apple Valley, CA 92307
3beds
2baths
1,937sqft
SingleFamily
Built in 1987
1.2 Acres Lot
$421,900 Zestimate®
$218/sqft
$-- HOA
Overview
- 240 days |
- 10 |
- 2 |
Facts & features
Interior
Bedrooms & bathrooms
- Bedrooms: 3
- Bathrooms: 2
Heating
- Forced air, Gas
Cooling
- Central, Solar
Appliances
- Included: Dishwasher, Garbage disposal, Microwave
Features
- Flooring: Carpet, Laminate
- Has fireplace: Yes
Interior area
- Total interior livable area: 1,937 sqft
Property
Parking
- Total spaces: 2
- Parking features: Garage - Attached
Features
- Has view: Yes
- View description: Mountain
Lot
- Size: 1.2 Acres
Details
- Parcel number: 0437032060000
Construction
Type & style
- Home type: SingleFamily
Materials
- wood frame
- Roof: Tile
Condition
- Year built: 1987
Community & HOA
Location
- Region: Apple Valley
Financial & listing details
- Price per square foot: $218/sqft
- Tax assessed value: $212,727
- Annual tax amount: $2,519
Visit our professional directory to find a foreclosure specialist in your area that can help with your home search.
Find a foreclosure agentForeclosure details
Estimated market value
$421,900
$384,000 - $456,000
$2,451/mo
Price history
| Date | Event | Price |
|---|---|---|
| 11/20/2014 | Sold | $177,000-9.2%$91/sqft |
Source: Public Record Report a problem | ||
| 8/10/2014 | Listed for sale | $194,900-2.9%$101/sqft |
Source: Exit Realty Blaine Associates #446284 Report a problem | ||
| 4/22/2014 | Sold | $200,793+35.7%$104/sqft |
Source: Public Record Report a problem | ||
| 3/1/2014 | Listed for sale | $148,000$76/sqft |
Source: HomeSource Real Estate Services, Inc. #433325 Report a problem | ||
| 10/28/2013 | Listing removed | $148,000$76/sqft |
Source: HomeSource Real Estate Services, Inc. #433325 Report a problem | ||
| 10/1/2013 | Price change | $148,000-6.3%$76/sqft |
Source: HomeSource Real Estate Services, Inc. #433325 Report a problem | ||
| 9/28/2013 | Price change | $158,000-4.2%$82/sqft |
Source: HomeSource Real Estate Services, Inc. #433325 Report a problem | ||
| 9/25/2013 | Price change | $165,000-1.8%$85/sqft |
Source: HomeSource Real Estate Services, Inc. #433325 Report a problem | ||
| 9/18/2013 | Listed for sale | $168,000$87/sqft |
Source: HomeSource Real Estate Services, Inc. #433325 Report a problem | ||
Public tax history
| Year | Property taxes | Tax assessment |
|---|---|---|
| 2025 | $2,519 -32.2% | $212,727 +2% |
| 2024 | $3,716 +53.2% | $208,556 +2% |
| 2023 | $2,426 +1.5% | $204,467 +2% |
| 2022 | $2,389 +2.3% | $200,458 +2% |
| 2021 | $2,334 +1.2% | $196,528 +1% |
| 2020 | $2,306 +1.9% | $194,513 +2% |
| 2019 | $2,263 +2.5% | $190,699 +2% |
| 2018 | $2,208 +1.4% | $186,959 +2% |
| 2017 | $2,178 | $183,293 +2% |
| 2016 | $2,178 +4.6% | $179,699 +1.5% |
| 2015 | $2,083 +1.5% | $177,000 -12.3% |
| 2014 | $2,052 | $201,807 +0.5% |
| 2013 | -- | $200,895 +2% |
| 2012 | -- | $196,956 +2% |
| 2011 | -- | $193,094 +0.8% |
| 2010 | -- | $191,651 -0.2% |
| 2009 | -- | $192,107 +2% |
| 2008 | -- | $188,340 +2% |
| 2007 | -- | $184,647 +2% |
| 2006 | -- | $181,027 +2% |
| 2005 | -- | $177,478 +2% |
| 2004 | -- | $173,998 +29.9% |
| 2003 | -- | $133,927 |
| 2002 | -- | $133,927 |
| 2001 | -- | $133,927 |
| 2000 | -- | $133,927 |
Find assessor info on the county website
Monthly payment
Estimated monthly payment
All calculations are estimates and provided by Zillow, Inc. for informational purposes only. Actual amounts may vary.
HOA fees may include property taxes on listings classified as Co-Ops. Contact the listing agent and/or owner for fee details.
Mortgage interest rates are dependent on a number of factors, including credit score, down payment, and repayment length. Interest rate data provided by Zillow Group Marketplace, Inc. as of 1/1/1970 from various mortgage lenders with which we have lead or other similar arrangements; the Estimated Payment is an average of those rates.
See how much you could borrow to make a competitive offer.
Climate risks
Neighborhood: 92307
Nearby schools
GreatSchools rating
- 4/10Sycamore Rocks Elementary SchoolGrades: K-6Distance: 0.6 mi
- 1/10Phoenix AcademyGrades: K-8Distance: 3.6 mi
- 4/10Granite Hills High SchoolGrades: 9-12Distance: 3.2 mi
- California
- San Bernardino County
- Apple Valley
- 92307
- 16873 Mesquite Rd
Nearby cities
Nearby zip codes
Other Apple Valley Topics
