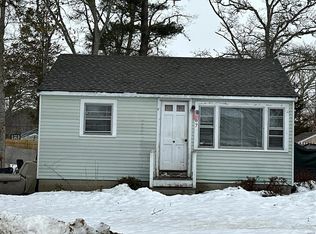
Located in the beautiful coastal community of Marion and offering a rare investment opportunity or to occupy yourself in this beautiful sought after town featuring gorgeous beaches and so much more This fixer upper could be yours with a little vision and elbow grease allowing you to make it your own. Don't miss out on this property!
For sale
$249,900
170 Wareham Rd, Marion, MA 02738
3beds
898sqft
Single Family Residence
Built in 1946
9,604 Square Feet Lot
$-- Zestimate®
$278/sqft
$-- HOA
What's special
- 6 days
- 977
- 66
Likely to sell faster than
Zillow last checked:
Listing updated:
Listed by:
Paula Tosca 508-230-4567,
Coldwell Banker Realty - Marion 508-748-3044
Source: MLS PIN,MLS#: 73593673
Facts & features
Interior
Bedrooms & bathrooms
- Bedrooms: 3
- Bathrooms: 1
- Full bathrooms: 1
Heating
- Forced Air, Oil
Cooling
- None
Features
- Basement: Partial
- Has fireplace: No
Interior area
- Total structure area: 898
- Total interior livable area: 898 sqft
- Finished area above ground: 898
Property
Parking
- Total spaces: 4
- Parking features: Detached, Off Street
- Garage spaces: 1
- Uncovered spaces: 3
Features
- Waterfront features: Bay, 1 to 2 Mile To Beach
Lot
- Size: 9,604 Square Feet
- Features: Wooded, Flood Plain
Details
- Parcel number: M:0007A B:0075 L:0000,3832978
- Zoning: inquire
Construction
Type & style
- Home type: SingleFamily
- Architectural style: Ranch
- Property subtype: Single Family Residence
Materials
- Foundation: Irregular
Condition
- Year built: 1946
Utilities & green energy
- Sewer: Public Sewer
- Water: Public
Community & HOA
HOA
- Has HOA: No
Location
- Region: Marion
Financial & listing details
- Price per square foot: $278/sqft
- Tax assessed value: $354,500
- Annual tax amount: $3,144
- Date on market: 10/21/2026
Estimated market value
Not available
Estimated sales range
Not available
$2,397/mo
Price history
| Date | Event | Price |
|---|---|---|
| 10/21/2026 | Listed for sale | $249,9000%$278/sqft |
Source: MLS PIN #73593673 Report a problem | ||
| 10/21/2026 | Listing removed | $250,000$278/sqft |
Source: MLS PIN #73524163 Report a problem | ||
| 9/16/2026 | Pending sale | $250,000$278/sqft |
Source: MLS PIN #73524163 Report a problem | ||
| 8/25/2026 | Price change | $250,000-16.6%$278/sqft |
Source: MLS PIN #73524163 Report a problem | ||
| 8/20/2026 | Listed for sale | $299,900$334/sqft |
Source: MLS PIN #73524163 Report a problem | ||
| 8/17/2026 | Pending sale | $299,900$334/sqft |
Source: MLS PIN #73524163 Report a problem | ||
| 5/26/2026 | Listed for sale | $299,900-14.3%$334/sqft |
Source: MLS PIN #73524163 Report a problem | ||
| 12/2/2024 | Listing removed | $350,000$390/sqft |
Source: MLS PIN #73236440 Report a problem | ||
| 8/29/2024 | Price change | $350,000-7.9%$390/sqft |
Source: MLS PIN #73236440 Report a problem | ||
| 6/1/2024 | Listed for sale | $380,000+8.9%$423/sqft |
Source: MLS PIN #73236440 Report a problem | ||
| 12/13/2022 | Listing removed | $349,000$389/sqft |
Source: MLS PIN #73012104 Report a problem | ||
| 7/14/2022 | Listed for sale | $349,000+232.4%$389/sqft |
Source: MLS PIN #73012104 Report a problem | ||
| 10/3/2008 | Sold | $105,000$117/sqft |
Source: Public Record Report a problem | ||
Public tax history
| Year | Property taxes | Tax assessment |
|---|---|---|
| 2025 | $2,853 -3.4% | $306,100 -4% |
| 2024 | $2,952 -2.3% | $318,800 -0.4% |
| 2023 | $3,023 +22% | $320,200 +40.3% |
| 2022 | $2,477 +10.9% | $228,300 +15.7% |
| 2021 | $2,233 +3.7% | $197,300 +7.2% |
| 2020 | $2,154 +9.3% | $184,100 +3.1% |
| 2019 | $1,970 -6.2% | $178,600 -2.6% |
| 2018 | $2,100 +3% | $183,400 +2.7% |
| 2017 | $2,038 +7.8% | $178,600 +6.9% |
| 2016 | $1,890 +14.5% | $167,100 +12.5% |
| 2015 | $1,650 -2% | $148,500 -6.5% |
| 2014 | $1,683 +12.7% | $158,900 +10.3% |
| 2013 | $1,493 +0.5% | $144,100 -5.8% |
| 2012 | $1,486 -1.1% | $153,000 -4.3% |
| 2011 | $1,503 -6.7% | $159,900 -15.1% |
| 2010 | $1,611 +2.5% | $188,400 -5.6% |
| 2009 | $1,571 +5.4% | $199,600 +1.2% |
| 2008 | $1,491 -0.1% | $197,200 -2.1% |
| 2007 | $1,493 +5.8% | $201,500 |
| 2006 | $1,411 +8.1% | $201,500 +23.1% |
| 2005 | $1,305 +11.6% | $163,700 +33.9% |
| 2004 | $1,169 +3.8% | $122,300 +9.4% |
| 2003 | $1,126 +4.7% | $111,800 +37.9% |
| 2002 | $1,075 | $81,100 |
Find assessor info on the county website
Monthly payment
Est. payment
Payment breakdown
Explore the cost of this home by adjusting the details. Changes won't be saved.Climate risks
Neighborhood: 02738


Similar homes
- $--2 bd1 ba840 sqft61 Taber St, New Bedford, MA 02740Auction
 Auction.com 2
- $--2 bd1 ba640 sqft67 Ryder St, Buzzards Bay, MA 02532Auction
 ServiceLink Auction
- $250,0003 bd1 ba1.3k sqft59 Bally Dr, Raynham, MA 02767For Sale
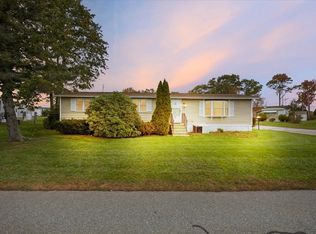 MLS ID #73593233, Heather Rose, Milestone Realty, Inc.. MLS PIN
- $--3 bd1 ba1.1k sqft537 S 2nd St, New Bedford, MA 02744Auction
 Xome
- $324,0002 bd1 ba768 sqft53 Plymouth Avenue, Wareham, MA 02571For Sale
 MLS ID #22605323, Mari Sennott Plus, Today Real Estate. CCIMLS
- $280,0002 bd1 ba1k sqft32-6 S Mdw Village, Carver, MA 02330For SaleMLS ID #22605043, Sue Menard, eXp Realty, LLC. CCIMLS
- $185,0002 bd1 ba736 sqft58 Kins Court, Onset, MA 02558For SaleMLS ID #22605155, Nancy S Angus, Upper Cape Realty Corp.. CCIMLS
