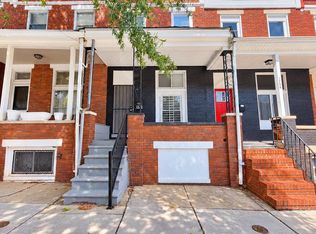
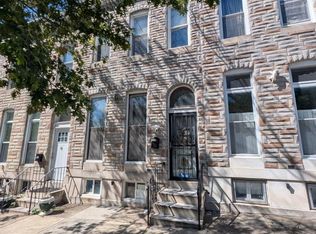
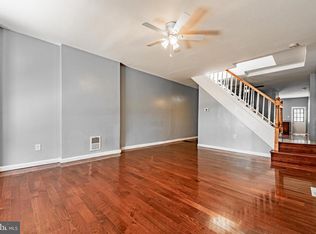
$171,100
-- bd-- ba-- sqft
1710 N Spring St, Baltimore, MD 21213
Off Market
Zillow last checked:
Listing updated:
Shawn Kerr 443-686-9750,
Union Preferred Realty,
Co-Listing Agent: Nicholas R Mcdaniels 443-340-7323,
Union Preferred Realty

Visit our professional directory to find a foreclosure specialist in your area that can help with your home search.
Find a foreclosure agent$116,600
$94,000 - $139,000
$1,520/mo
| Date | Event | Price |
|---|---|---|
| 10/1/2026 | Sold | $77,900-13.4% |
Source: Public Record Report a problem | ||
| 3/8/2024 | Listing removed | -- |
Source: Zillow Rentals Report a problem | ||
| 2/22/2024 | Price change | $1,270-1.9% |
Source: Zillow Rentals Report a problem | ||
| 2/8/2024 | Sold | $90,000 |
Source: Public Record Report a problem | ||
| 2/7/2024 | Price change | $1,295-10.7% |
Source: Zillow Rentals Report a problem | ||
| 1/3/2024 | Price change | $1,450-12.1% |
Source: Zillow Rentals Report a problem | ||
| 12/12/2023 | Listed for rent | $1,650 |
Source: Zillow Rentals Report a problem | ||
| 12/1/2023 | Sold | $90,000+12.5% |
Source:  Bright MLS #MDBA2100324 Report a problem | ||
| 10/15/2023 | Pending sale | $80,000 |
Source: Bright MLS #MDBA2100324 Report a problem | ||
| 10/8/2023 | Listed for sale | $80,000+566.7% |
Source: Bright MLS #MDBA2100324 Report a problem | ||
| 4/4/2018 | Sold | $12,000-52% |
Source: eXp Realty #14785074 Report a problem | ||
| 11/30/2017 | Price change | $25,000-37.5% |
Source: Towson #1003295557 Report a problem | ||
| 10/31/2017 | Price change | $40,000-11.1% |
Source: Towson #BA10076341 Report a problem | ||
| 10/7/2017 | Listed for sale | $45,000+2268.4% |
Source: Keller Williams Excellence #BA10076341 Report a problem | ||
| 1/30/2002 | Sold | $1,900-90.5% |
Source: Public Record Report a problem | ||
| 6/22/2001 | Sold | $20,000-50% |
Source: Public Record Report a problem | ||
| 11/2/1998 | Sold | $40,000 |
Source: Public Record Report a problem | ||
| Year | Property taxes | Tax assessment |
|---|---|---|
| 2025 | $1,770 +14.8% | $75,000 +14.8% |
| 2024 | $1,542 +17.4% | $65,333 +17.4% |
| 2023 | $1,314 +21% | $55,667 +21% |
| 2022 | $1,086 +1.5% | $46,000 +1.5% |
| 2021 | $1,070 +1.5% | $45,333 +1.5% |
| 2020 | $1,054 +1.5% | $44,667 +1.5% |
| 2019 | $1,038 +3.1% | $44,000 +3.1% |
| 2018 | $1,007 +3.2% | $42,667 +3.2% |
| 2017 | $975 +243.2% | $41,333 +3.3% |
| 2016 | $284 | $40,000 +30.4% |
| 2015 | $284 | $30,667 +43.8% |
| 2014 | $284 | $21,333 +77.8% |
| 2013 | -- | $12,000 |
| 2012 | -- | $12,000 |
| 2011 | -- | $12,000 -14.9% |
| 2010 | -- | $14,100 +35.6% |
| 2009 | -- | $10,400 +246.7% |
| 2008 | -- | $3,000 |
| 2007 | -- | $3,000 |
| 2006 | -- | $3,000 |
| 2005 | -- | $3,000 -70.6% |
| 2004 | -- | $10,200 +7.4% |
| 2003 | -- | $9,500 +8% |
| 2002 | -- | $8,800 +8.6% |
| 2001 | -- | $8,100 |
Source: Bright MLS. This data may not be complete. We recommend contacting the local school district to confirm school assignments for this home.