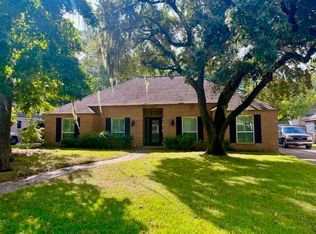
$346,700
4 bd|3 ba|2.9k sqft
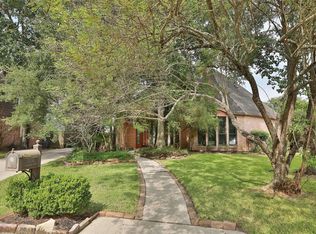
17814 Clearlight Ln, Spring, TX 77379
Off Market
Zillow last checked:
Listing updated:
Michelle Hatcher TREC #0621918 832-794-3559,
Twin Empire Group, LLC
$308,200
$293,000 - $324,000
$2,600/mo
| Date | Event | Price |
|---|---|---|
| 4/10/2026 | Price change | $309,700-0.1%$104/sqft |
Source: | ||
| 4/3/2026 | Pending sale | $310,000$104/sqft |
Source: | ||
| 3/22/2026 | Price change | $310,000-8.8%$104/sqft |
Source: | ||
| 1/3/2026 | Price change | $340,000+0.1%$114/sqft |
Source: | ||
| 12/11/2025 | Listed for sale | $339,500+23.5%$114/sqft |
Source: | ||
| 8/11/2020 | Listing removed | $275,000$92/sqft |
Source: Fast Homes #49464476 Report a problem | ||
| 7/9/2020 | Pending sale | $275,000$92/sqft |
Source: Fast Homes #49464476 Report a problem | ||
| 11/28/2019 | Listed for sale | $275,000+7.8%$92/sqft |
Source: Fast Homes #49464476 Report a problem | ||
| 5/24/2019 | Listing removed | $255,000$86/sqft |
Source: RE/MAX Northwest, REALTORS #28335461 Report a problem | ||
| 5/17/2019 | Pending sale | $255,000$86/sqft |
Source: RE/MAX Northwest, REALTORS #28335461 Report a problem | ||
| 3/10/2019 | Listed for sale | $255,000$86/sqft |
Source: RE/MAX Northwest, REALTORS #28335461 Report a problem | ||
| 3/6/2019 | Pending sale | $255,000$86/sqft |
Source: RE/MAX Northwest, REALTORS #28335461 Report a problem | ||
| 3/1/2019 | Price change | $255,000-1.9%$86/sqft |
Source: RE/MAX Northwest, REALTORS #28335461 Report a problem | ||
| 12/13/2018 | Price change | $259,900-3.7%$87/sqft |
Source: RE/MAX Northwest, REALTORS #28335461 Report a problem | ||
| 10/16/2018 | Price change | $269,900-1.8%$91/sqft |
Source: RE/MAX Northwest, REALTORS #28335461 Report a problem | ||
| 8/7/2018 | Price change | $274,900-3.5%$92/sqft |
Source: RE/MAX Northwest, REALTORS #28335461 Report a problem | ||
| 1/31/2018 | Listed for sale | $285,000$96/sqft |
Source: Carswell Real Estate Co. Inc. #16659979 Report a problem | ||
| Year | Property taxes | Tax assessment |
|---|---|---|
| 2025 | $6,880 +1% | $374,944 |
| 2024 | $6,810 -3.2% | $374,944 -6.8% |
| 2023 | $7,037 -3.5% | $402,237 +7.5% |
| 2022 | $7,296 | $374,182 +34.5% |
| 2021 | -- | $278,217 +6.4% |
| 2020 | $5,579 +299.9% | $261,604 +27.1% |
| 2019 | $1,395 -72.1% | $205,811 |
| 2018 | $4,998 | $205,811 -0.6% |
| 2017 | $4,998 -2.1% | $207,006 |
| 2016 | $5,104 +24.7% | $207,006 +10.8% |
| 2015 | $4,093 | $186,890 +3.3% |
| 2014 | $4,093 | $180,991 +23.4% |
| 2013 | -- | $146,691 |
| 2012 | -- | $146,691 -9.2% |
| 2011 | -- | $161,538 |
| 2010 | -- | $161,538 -14.5% |
| 2009 | -- | $188,967 +4.7% |
| 2007 | -- | $180,560 +13.3% |
| 2006 | -- | $159,328 |
| 2005 | -- | $159,328 -1.4% |
| 2004 | -- | $161,600 |
| 2003 | -- | $161,600 +6.8% |
| 2002 | -- | $151,300 +10% |
| 2001 | -- | $137,600 |
| 2000 | -- | $137,600 |
Find assessor info on the county website
Source: HAR. This data may not be complete. We recommend contacting the local school district to confirm school assignments for this home.
A local agent can set up tours, give advice and negotiate with sellers.