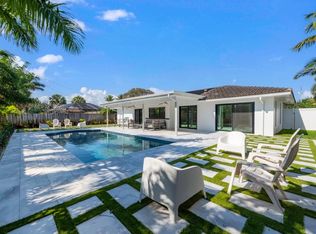
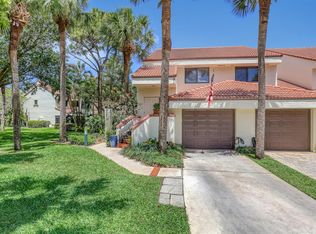
This 1628 square foot single family home has 4 bedrooms and 2.0 bathrooms. This home is located at 1813 Tudor Rd, North Palm Beach, FL 33408.
Pre-foreclosure
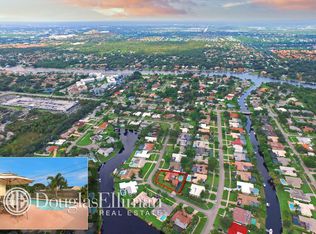
Street View
Est. $740,300
1813 Tudor Rd, North Palm Beach, FL 33408
4beds
2baths
1,628sqft
SingleFamily
Built in 1969
9,844 Square Feet Lot
$740,300 Zestimate®
$455/sqft
$-- HOA
Overview
- 63 days |
- 116 |
- 15 |
Facts & features
Interior
Bedrooms & bathrooms
- Bedrooms: 4
- Bathrooms: 2
Heating
- Forced air
Cooling
- Central
Features
- Flooring: Carpet
Interior area
- Total interior livable area: 1,628 sqft
Property
Parking
- Parking features: Garage
Features
- Exterior features: Stucco
Lot
- Size: 9,844 Square Feet
Details
- Parcel number: 00434133030060230
Construction
Type & style
- Home type: SingleFamily
Materials
- masonry
- Roof: Tile
Condition
- Year built: 1969
Community & HOA
Location
- Region: North Palm Beach
Financial & listing details
- Price per square foot: $455/sqft
- Tax assessed value: $635,447
- Annual tax amount: $3,433
Visit our professional directory to find a foreclosure specialist in your area that can help with your home search.
Find a foreclosure agentForeclosure details
Estimated market value
$740,300
$674,000 - $814,000
$4,515/mo
Price history
| Date | Event | Price |
|---|---|---|
| 12/1/1990 | Sold | $144,100$89/sqft |
Source: Agent Provided Report a problem | ||
Public tax history
| Year | Property taxes | Tax assessment |
|---|---|---|
| 2024 | $3,433 -4.7% | $203,296 +3% |
| 2023 | $3,601 +0.9% | $197,375 +3% |
| 2022 | $3,569 +1.4% | $191,626 +3% |
| 2021 | $3,521 +13.6% | $186,045 +1.4% |
| 2020 | $3,100 +1.3% | $183,476 +2.3% |
| 2019 | $3,061 | $179,351 +1.9% |
| 2018 | $3,061 +7.4% | $176,007 +2.1% |
| 2017 | $2,851 +2.8% | $172,387 +2.1% |
| 2016 | $2,775 +0.2% | $168,841 +0.7% |
| 2015 | $2,769 -2.4% | $167,667 +0.8% |
| 2014 | $2,838 +2.3% | $166,336 +1.5% |
| 2013 | $2,775 -3.8% | $163,878 +1.7% |
| 2012 | $2,886 +1.3% | $161,139 +3% |
| 2011 | $2,850 +1.5% | $156,446 +1.5% |
| 2010 | $2,808 +8% | $154,134 +2.7% |
| 2009 | $2,599 +13.3% | $150,082 +0.1% |
| 2008 | $2,293 -1.8% | $149,932 +3% |
| 2007 | $2,336 -7.3% | $145,565 +2.5% |
| 2006 | $2,520 | $142,015 +3% |
| 2005 | -- | $137,879 +3% |
| 2004 | $1,110 +287.1% | $133,863 +1.9% |
| 2003 | $287 -87.4% | $131,367 +2.4% |
| 2002 | $2,276 +0.7% | $128,288 +1.6% |
| 2001 | $2,261 +5.1% | $126,268 +3% |
| 2000 | $2,150 +16.1% | $122,590 -0.5% |
| 1999 | $1,852 | $123,240 |
Find assessor info on the county website
Monthly payment
Estimated monthly payment$1,822
All calculations are estimates and provided by Zillow, Inc. for informational purposes only. Actual amounts may vary.
HOA fees may include property taxes on listings classified as Co-Ops. Contact the listing agent and/or owner for fee details.
Mortgage interest rates are dependent on a number of factors, including credit score, down payment, and repayment length. Interest rate data provided by Zillow Group Marketplace, Inc. as of 1/1/1970 from various mortgage lenders with which we have lead or other similar arrangements; the Estimated Payment is an average of those rates.
See how much you could borrow to make a competitive offer.
Climate risks
Neighborhood: Juno Beach
Nearby schools
GreatSchools rating
- 8/10The Conservatory SchoolGrades: PK-8Distance: 3.6 mi
- 6/10William T. Dwyer High SchoolGrades: PK,9-12Distance: 2.9 mi
- 5/10Howell L. Watkins Middle SchoolGrades: 6-8Distance: 3.7 mi


Nearby cities
Nearby neighborhoods
Nearby zip codes
Other North Palm Beach Topics
- Apartments for Rent in 33408
- Houses for Sale in 33408
- Houses for Rent in 33408
- 33408 Real Estate
- North Palm Beach Condos
- Houses for Sale in North Palm Beach
- Newest Listings in North Palm Beach
- North Palm Beach Home Values
- North Palm Beach Real Estate Agents
- North Palm Beach Refinance
- North Palm Beach Mortgage Rates
