Skip main navigation
Pre-foreclosure
  • Est. $232,900

    1827 Mohawk Rd, Pueblo, CO 81001

    3beds
    936sqft
    SingleFamily
    Built in 1960
    10,541 Square Feet Lot
    $232,900 Zestimate®
    $249/sqft
    $-- HOA

    Overview

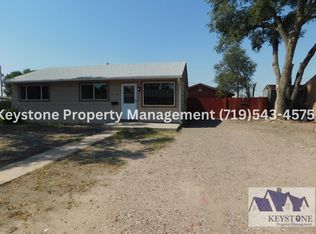
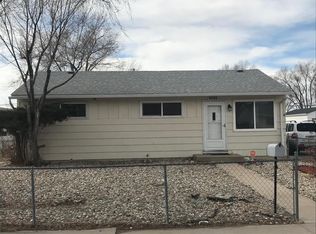
    Great renovated family home in a quiet neighborhood. Home features new roof, new paint and floors, new appliances and completely remodeled bath.
    250 days
    |
    72
    |
    0
    |

      Facts & features

      Interior

      Bedrooms & bathrooms
      • Bedrooms: 3
      • Bathrooms: 1
      • Full bathrooms: 1
      Heating
      • Forced air
      Cooling
      • Evaporative
      Features
      • New Floor Coverings, New Paint
      • Has fireplace: Yes
      Interior area
      • Total interior livable area: 936 sqft

      Property

      Parking
      • Total spaces: 1
      • Parking features: Carport
      Features
      • Exterior features: Wood
      Lot
      • Size: 10,541 Square Feet
      Details
      • Parcel number: 419202005

      Construction

      Type & style
      • Home type: SingleFamily
      Materials
      • Frame
      • Roof: Composition
      Condition
      • Year built: 1960

      Community & HOA

      Location
      • Region: Pueblo

      Financial & listing details

      • Price per square foot: $249/sqft
      • Tax assessed value: $206,811
      • Annual tax amount: $973

      Visit our professional directory to find a foreclosure specialist in your area that can help with your home search.

      Find a foreclosure agent

        Foreclosure details

        Estimated market value

        $232,900

        $217,000 - $247,000

        $1,332/mo

        Price history

        DateEventPrice
        5/11/2020Sold$170,000+0.6%$182/sqft
        Source: Public Record Report a problem
        4/10/2020Price change$169,000-5.6%$181/sqft
        Source: Keller Williams Performance Realty #185306 Report a problem
        3/31/2020Listed for sale$179,000+40.4%$191/sqft
        Source: Keller Williams Performance Realty #185306 Report a problem
        2/6/2020Listing removed$127,500$136/sqft
        Source: Keller Williams Performance Realty #184083 Report a problem
        1/31/2020Listed for sale$127,500+47.4%$136/sqft
        Source: Keller Williams Performance Realty #184083 Report a problem
        1/21/2020Sold$86,500-35.9%$92/sqft
        Source: Public Record Report a problem
        1/18/2020Listed for sale$135,000+67.7%$144/sqft
        Source: Keller Williams Performance Realty #184083 Report a problem
        12/1/2016Sold$80,500-6.4%$86/sqft
        Source: PAR #163793 Report a problem
        9/26/2016Listed for sale$86,000-22.9%$92/sqft
        Source: Palomar Properties #163793 Report a problem
        8/21/2014Listing removed$595$1/sqft
        Source: Zillow Rental Network Report a problem
        8/19/2014Price change$595-7.8%$1/sqft
        Source: Zillow Rental Network Report a problem
        7/18/2014Listed for rent$645$1/sqft
        Source: Zillow Rental Network Report a problem
        6/4/2010Listing removed$111,500$119/sqft
        Source: Systems Engineering, Inc. #128017 Report a problem
        2/27/2010Listed for sale$111,500+5.2%$119/sqft
        Source: Systems Engineering, Inc. #128017 Report a problem
        4/25/2007Sold$106,000$113/sqft
        Source: Public Record Report a problem

        Public tax history

        YearProperty taxesTax assessment
        2025$973 -1.2%$12,930 -6.8%
        2024$985 -5.2%$13,870 -1%
        2023$1,039 -3.2%$14,010 +31.3%
        2022$1,073 +44.4%$10,670 -2.8%
        2021$743 -0.1%$10,980 +46.3%
        2020$744 +22.2%$7,507 +11.8%
        2018$609 $6,717
        2017$609 +13.6%$6,717 +13.4%
        2016$536 $5,921
        2015$536 +0.7%$5,921 +1.1%
        2014$532 -6.2%$5,854
        2013$567 -7.4%$5,854 -5.5%
        2012$613 $6,195
        2011$613 +3%$6,195 -5%
        2010$595 -8%$6,524 -0.1%
        2009$647 -1.8%$6,530 -6.6%
        2008$658 -1.1%$6,990
        2007$665 +4.5%$6,990 +2.8%
        2006$637 +14.9%$6,800 +20.1%
        2005$554 +1.4%$5,660
        2004$546 -10.9%$5,660 -0.9%
        2003$613 +10.8%$5,710 -11.6%
        2002$553 +5.3%$6,460 +1.6%
        2001$526 $6,360

        Find assessor info on the county website

        Monthly payment

        Estimated monthly payment
        All calculations are estimates and provided by Zillow, Inc. for informational purposes only. Actual amounts may vary.
        HOA fees may include property taxes on listings classified as Co-Ops. Contact the listing agent and/or owner for fee details.
        Mortgage interest rates are dependent on a number of factors, including credit score, down payment, and repayment length. Interest rate data provided by Zillow Group Marketplace, Inc. as of 1/1/1970 from various mortgage lenders with which we have lead or other similar arrangements; the Estimated Payment is an average of those rates.
        See how much you could borrow to make a competitive offer.

        Climate risks

        Neighborhood: Belmont

        Getting around

        52 / 100
        Somewhat Walkable
        57 / 100
        Bikeable

        Nearby schools

        GreatSchools rating
        Schools provided by the listing agent
        • District: D60

        Source: The MLS. This data may not be complete. We recommend contacting the local school district to confirm school assignments for this home.

        Similar homes

        Skip to the end of the carouselSkip to the beginning of the carousel