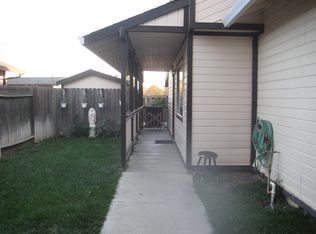
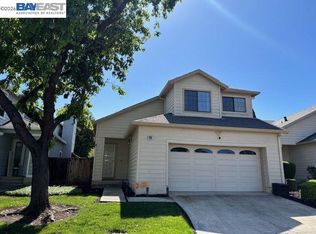
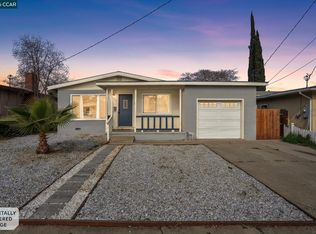
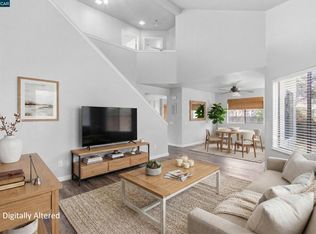
This 1029 square foot multi family home has 3 bedrooms and 1.0 bathrooms. This home is located at 150 Pasco Dr, Brentwood, CA 94513.
Foreclosed
Est. $577,422
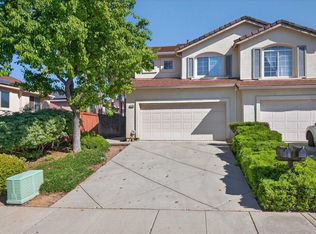
150 Pasco Dr, Brentwood, CA 94513
3beds
1,029sqft
MultiFamily
Built in 1995
-- sqft lot
$-- Zestimate®
$561/sqft
$-- HOA
Overview
- 85 days |
- 54 |
- 0 |
Facts & features
Interior
Bedrooms & bathrooms
- Bedrooms: 3
- Bathrooms: 1
- Full bathrooms: 1
Heating
- Forced air, Gas
Cooling
- Central
Appliances
- Laundry: In Garage
Features
- Flooring: Tile
Interior area
- Structure area source: Verified
- Total interior livable area: 1,029 sqft
Property
Parking
- Total spaces: 1
- Parking features: Garage - Attached
Features
- Exterior features: Stucco
Lot
- Size: 6,921 Square Feet
- Features: Irregular Lot, Landscaped, Landscape Front
Details
- Parcel number: 0160200507
- Zoning: R-1
- Special conditions: Standard
Construction
Type & style
- Home type: MultiFamily
- Architectural style: Contemporary
Materials
- Roof: Composition
Condition
- Year built: 1995
Utilities & green energy
- Sewer: In & Connected
- Water: Meter on Site
- Utilities for property: Natural Gas Available
Community & HOA
Location
- Region: Brentwood
Financial & listing details
- Price per square foot: $561/sqft
- Tax assessed value: $577,422
- Annual tax amount: $6,522
Visit our professional directory to find a foreclosure specialist in your area that can help with your home search.
Find a foreclosure agentForeclosure details
Estimated market value
Not available
Estimated sales range
Not available
$2,488/mo
Price history
Price history
| Date | Event | Price |
|---|---|---|
| 1/8/2026 | Sold | $393,750-28.4%$383/sqft |
Source: Public Record Report a problem | ||
| 4/10/2025 | Listing removed | $550,000$534/sqft |
Source: | ||
| 12/15/2024 | Pending sale | $550,000$534/sqft |
Source: | ||
| 12/12/2024 | Price change | $550,000+4.8%$534/sqft |
Source: | ||
| 11/19/2024 | Price change | $525,000-7.7%$510/sqft |
Source: | ||
| 10/17/2024 | Listed for sale | $568,500$552/sqft |
Source: | ||
| 10/11/2024 | Listing removed | $568,500$552/sqft |
Source: | ||
| 10/4/2024 | Price change | $568,500-0.2%$552/sqft |
Source: | ||
| 8/21/2024 | Price change | $569,900-0.9%$554/sqft |
Source: | ||
| 6/27/2024 | Price change | $575,000-1.7%$559/sqft |
Source: | ||
| 5/30/2024 | Listed for sale | $585,000+5.4%$569/sqft |
Source: | ||
| 10/7/2022 | Sold | $555,000+3%$539/sqft |
Source: | ||
| 9/13/2022 | Pending sale | $539,000$524/sqft |
Source: | ||
| 9/7/2022 | Price change | $539,000-8.5%$524/sqft |
Source: | ||
| 8/24/2022 | Listed for sale | $589,000+70.7%$572/sqft |
Source: | ||
| 11/15/2021 | Sold | $345,000-20.7%$335/sqft |
Source: | ||
| 10/22/2021 | Pending sale | $435,000$423/sqft |
Source: MetroList Services of CA #221129036 Report a problem | ||
| 10/14/2021 | Listed for sale | $435,000+273.4%$423/sqft |
Source: MetroList Services of CA #221129036 Report a problem | ||
| 5/15/2009 | Sold | $116,500-6.7%$113/sqft |
Source: Public Record Report a problem | ||
| 2/1/2009 | Price change | $124,900-6.8%$121/sqft |
Source: foreclosure.com Report a problem | ||
| 1/31/2009 | Price change | $134,000-13.5%$130/sqft |
Source: foreclosure.com Report a problem | ||
| 12/30/2008 | Price change | $154,900+15.6%$151/sqft |
Source: foreclosure.com Report a problem | ||
| 12/14/2008 | Price change | $134,000-13.5%$130/sqft |
Source: foreclosure.com Report a problem | ||
| 12/12/2008 | Price change | $154,900+15.6%$151/sqft |
Source: foreclosure.com Report a problem | ||
| 12/6/2008 | Price change | $134,000-10.6%$130/sqft |
Source: foreclosure.com Report a problem | ||
| 11/5/2008 | Price change | $149,900-3.2%$146/sqft |
Source: foreclosure.com Report a problem | ||
| 10/1/2008 | Listed for sale | $154,900-20.6%$151/sqft |
Source: foreclosure.com Report a problem | ||
| 3/25/2008 | Sold | $195,000+509.4%$190/sqft |
Source: Public Record Report a problem | ||
| 11/10/1994 | Sold | $32,000$31/sqft |
Source: Public Record Report a problem | ||
Public tax history
Public tax history
| Year | Property taxes | Tax assessment |
|---|---|---|
| 2025 | $6,522 +1.7% | $577,422 +2% |
| 2024 | $6,415 -18.6% | $566,100 +2% |
| 2023 | $7,884 +89% | $555,000 +60.9% |
| 2022 | $4,173 +138.9% | $345,000 +147.9% |
| 2021 | $1,746 +0.5% | $139,181 +1% |
| 2020 | $1,737 -0.3% | $137,755 +2% |
| 2019 | $1,743 +6.2% | $135,055 +2% |
| 2018 | $1,641 0% | $132,408 +2% |
| 2017 | $1,642 +4% | $129,813 +2% |
| 2016 | $1,579 +3.2% | $127,269 +1.5% |
| 2015 | $1,530 | $125,358 +2% |
| 2014 | $1,530 | $122,903 +0.5% |
| 2013 | -- | $122,349 +2% |
| 2012 | -- | $119,951 +2% |
| 2011 | -- | $117,600 +0.8% |
| 2010 | -- | $116,722 -12% |
| 2009 | -- | $132,600 +7.7% |
| 2008 | -- | $123,120 +2% |
| 2007 | -- | $120,707 +2% |
| 2006 | -- | $118,341 +2% |
| 2005 | -- | $116,021 +2% |
| 2004 | -- | $113,747 +1.9% |
| 2003 | -- | $111,664 +2% |
| 2002 | -- | $109,476 +2% |
| 2001 | -- | $107,330 |
Find assessor info on the county website
Monthly payment
Estimated monthly payment
All calculations are estimates and provided by Zillow, Inc. for informational purposes only. Actual amounts may vary.
HOA fees may include property taxes on listings classified as Co-Ops. Contact the listing agent and/or owner for fee details.
Mortgage interest rates are dependent on a number of factors, including credit score, down payment, and repayment length. Interest rate data provided by Zillow Group Marketplace, Inc. as of 1/1/1970 from various mortgage lenders with which we have lead or other similar arrangements; the Estimated Payment is an average of those rates.
See how much you could borrow to make a competitive offer.
Climate risks
Neighborhood: 94513
Nearby schools
GreatSchools rating
- 5/10Marsh Creek Elementary SchoolGrades: K-5Distance: 0.3 mi
- 4/10William B. Bristow Middle SchoolGrades: 6-8Distance: 1.3 mi
- 7/10Liberty High SchoolGrades: 9-12Distance: 1.2 mi
- California
- Contra Costa County
- Brentwood
- 94513
- 150 Pasco Dr
Nearby cities
Nearby zip codes
Other Brentwood Topics
