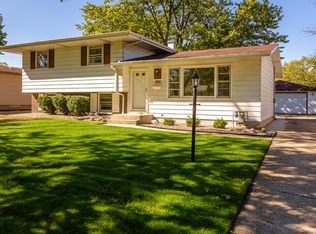
$224,100
3 bd|2 ba|1.1k sqft
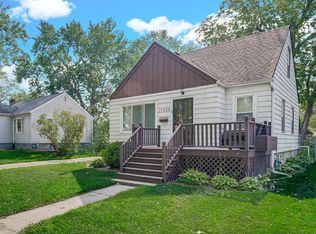
18933 Ridgewood Ave, Lansing, IL 60438
Off Market
Zillow last checked: 8 hours ago
Listing updated: February 27, 2026 at 01:12am
Jim Samuelson 219-746-5747,
Berkshire Hathaway HomeServices Executive Realty
$280,400
$266,000 - $294,000
$2,138/mo
| Date | Event | Price |
|---|---|---|
| 2/27/2026 | Pending sale | $279,900$145/sqft |
Source: | ||
| 2/6/2026 | Contingent | $279,900$145/sqft |
Source: | ||
| 1/30/2026 | Listed for sale | $279,900$145/sqft |
Source: | ||
| 11/27/2025 | Listing removed | $279,900$145/sqft |
Source: Berkshire Hathaway HomeServices Michigan and Northern Indiana Real Estate #12274625 Report a problem | ||
| 10/7/2025 | Price change | $279,900-1.8%$145/sqft |
Source: | ||
| 9/15/2025 | Price change | $284,900-1.7%$148/sqft |
Source: | ||
| 6/4/2025 | Price change | $289,900-1.7%$150/sqft |
Source: | ||
| 4/15/2025 | Price change | $294,900-1.7%$153/sqft |
Source: | ||
| 3/14/2025 | Price change | $299,900-1.6%$156/sqft |
Source: | ||
| 2/10/2025 | Price change | $304,900-3.2%$158/sqft |
Source: | ||
| 1/21/2025 | Listed for sale | $314,900+79.9%$163/sqft |
Source: | ||
| 8/22/2024 | Sold | $175,000-23.9%$91/sqft |
Source: Public Record Report a problem | ||
| 4/13/2023 | Listing removed | -- |
Source: Berkshire Hathaway HomeServices Michigan and Northern Indiana Real Estate Report a problem | ||
| 3/23/2023 | Listed for sale | $229,900$119/sqft |
Source: | ||
| 3/4/2023 | Contingent | $229,900$119/sqft |
Source: | ||
| 2/16/2023 | Listed for sale | $229,900$119/sqft |
Source: | ||
| Year | Property taxes | Tax assessment |
|---|---|---|
| 2023 | $6,839 +73.4% | $21,999 +70.9% |
| 2022 | $3,944 +1.3% | $12,874 |
| 2021 | $3,893 +0.8% | $12,874 |
| 2020 | $3,861 +10.6% | $12,874 -0.4% |
| 2019 | $3,489 +3% | $12,922 |
| 2018 | $3,388 +0.5% | $12,922 |
| 2017 | $3,371 -5.8% | $12,922 +10% |
| 2016 | $3,576 +6.3% | $11,742 |
| 2015 | $3,366 -19.1% | $11,742 |
| 2014 | $4,163 -17.2% | $11,742 -20.9% |
| 2013 | $5,030 +1.7% | $14,847 |
| 2012 | $4,945 +3.5% | $14,847 |
| 2011 | $4,777 +6.7% | $14,847 -13.2% |
| 2010 | $4,478 +11.3% | $17,101 |
| 2009 | $4,024 +13.7% | $17,101 -5% |
| 2008 | $3,540 +1.6% | $18,001 +11.2% |
| 2007 | $3,486 +5.2% | $16,182 |
| 2006 | $3,312 +7.2% | $16,182 |
| 2005 | $3,090 -0.8% | $16,182 +18% |
| 2004 | $3,116 +4.9% | $13,718 |
| 2003 | $2,971 +3% | $13,718 |
| 2002 | $2,884 +5.6% | $13,718 +4.8% |
| 2001 | $2,731 +2.3% | $13,095 |
| 2000 | $2,670 +0% | $13,095 |
| 1999 | $2,670 | $13,095 |
Find assessor info on the county website
Source: MRED as distributed by MLS GRID. This data may not be complete. We recommend contacting the local school district to confirm school assignments for this home.