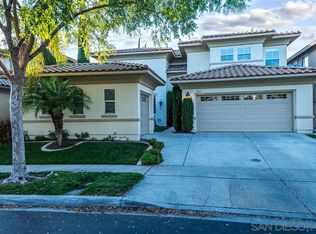
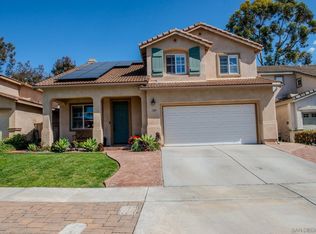
This 2950 square foot single family home has 4 bedrooms and 3.0 bathrooms. This home is located at 1928 Lagrange Rd, Chula Vista, CA 91913.
Pre-foreclosure
Est. $1,277,400
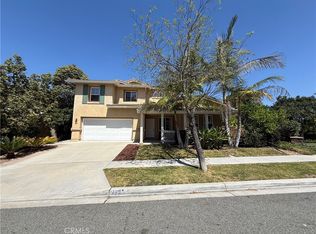
1928 Lagrange Rd, Chula Vista, CA 91913
4beds
2,950sqft
SingleFamily
Built in 2002
7,501 Square Feet Lot
$1,277,400 Zestimate®
$433/sqft
$105/mo HOA
Overview
- 352 days |
- 13 |
- 0 |
Facts & features
Interior
Bedrooms & bathrooms
- Bedrooms: 4
- Bathrooms: 3
- Full bathrooms: 3
Interior area
- Total interior livable area: 2,950 sqft
Property
Parking
- Total spaces: 3
Lot
- Size: 7,501 Square Feet
Details
- Parcel number: 6434701900
Construction
Type & style
- Home type: SingleFamily
Condition
- Year built: 2002
Community & HOA
HOA
- Has HOA: Yes
- HOA fee: $105 monthly
Location
- Region: Chula Vista
Financial & listing details
- Price per square foot: $433/sqft
- Tax assessed value: $1,105,242
- Annual tax amount: $17,314
Visit our professional directory to find a foreclosure specialist in your area that can help with your home search.
Find a foreclosure agentForeclosure details
Estimated market value
$1,277,400
$1.21M - $1.34M
$5,344/mo
Price history
Price history
| Date | Event | Price |
|---|---|---|
| 7/28/2018 | Listing removed | $695,000$236/sqft |
Source: Casas Advisors #180003868 Report a problem | ||
| 7/26/2018 | Pending sale | $695,000$236/sqft |
Source: Casas Advisors #180003868 Report a problem | ||
| 7/26/2018 | Listed for sale | $695,000-15.8%$236/sqft |
Source: Casas Advisors #180003868 Report a problem | ||
| 11/30/2006 | Sold | $825,000+88.4%$280/sqft |
Source: Public Record Report a problem | ||
| 11/15/2002 | Sold | $438,000$148/sqft |
Source: Public Record Report a problem | ||
Public tax history
Public tax history
| Year | Property taxes | Tax assessment |
|---|---|---|
| 2025 | $17,314 +3.1% | $1,105,242 +2% |
| 2024 | $16,798 +6.3% | $1,083,571 +8.4% |
| 2023 | $15,805 +5.3% | $1,000,000 +5.3% |
| 2022 | $15,004 +19.2% | $950,000 +28.4% |
| 2021 | $12,583 +5.3% | $740,000 +5.7% |
| 2020 | $11,954 +56.5% | $700,000 +1.4% |
| 2019 | $7,640 -34.5% | $690,000 |
| 2018 | $11,663 +9.8% | $690,000 +15% |
| 2017 | $10,624 +1.1% | $600,000 -1.6% |
| 2016 | $10,509 +6.9% | $610,000 +8.9% |
| 2015 | $9,827 +8.9% | $560,000 +15.5% |
| 2014 | $9,025 | $485,000 +8.7% |
| 2013 | -- | $446,000 |
| 2012 | -- | $446,000 |
| 2011 | -- | $446,000 |
| 2010 | -- | $446,000 |
| 2009 | -- | $446,000 -15% |
| 2008 | -- | $525,000 -36.4% |
| 2007 | -- | $825,000 +77.8% |
| 2006 | -- | $464,095 +2% |
| 2005 | -- | $454,996 +2% |
| 2004 | -- | $446,075 +1.9% |
| 2003 | -- | $437,900 |
Find assessor info on the county website
Monthly payment
Estimated monthly payment
All calculations are estimates and provided by Zillow, Inc. for informational purposes only. Actual amounts may vary.
HOA fees may include property taxes on listings classified as Co-Ops. Contact the listing agent and/or owner for fee details.
Mortgage interest rates are dependent on a number of factors, including credit score, down payment, and repayment length. Interest rate data provided by Zillow Group Marketplace, Inc. as of 1/1/1970 from various mortgage lenders with which we have lead or other similar arrangements; the Estimated Payment is an average of those rates.
See how much you could borrow to make a competitive offer.
Climate risks
Neighborhood: Otay Ranch Village 5
Nearby schools
GreatSchools rating
- 10/10McMillin (Corky) Elementary SchoolGrades: K-6Distance: 0.5 mi
- 6/10Rancho Del Rey Middle SchoolGrades: 7-8Distance: 1.8 mi
- 9/10Olympian High SchoolGrades: 9-12Distance: 2.3 mi
- California
- San Diego County
- Chula Vista
- 91913
- Otay Ranch Village 5
- 1928 Lagrange Rd
Nearby cities
Nearby neighborhoods
Nearby zip codes
Other Chula Vista Topics
