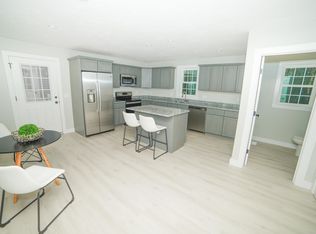
Three FOrm A lots, 60,000 SF totaling 4.59 Acres. 525' Frontage.
This property is off market, which means it's not currently listed for sale or rent on Zillow. This may be different from what's available on other websites or public sources.
Not available
Estimated sales range
Not available
$2,592/mo
List your home for rent
$2,592/mo
Rent Zestimate®
Find your next renter with Zillow Rental Manager. Plus, with online applications, you can quickly screen prospective tenants – for free.
Learn more$2,592/mo
Rent Zestimate®
Refinance and save
$32,999/mo
Est. payment
Refinancing to a lower rate could help reduce your monthly payments and save thousands over the life of the loan.
See today's rates$32,999/mo
Est. payment
Work with a Zillow partner agent
Leverage their expertise and Zillow's premium Showcase listings to get your home seen by more buyers.
Get startedList with your own agent
Get your home in front of millions of buyers by listing it on Zillow.
Learn how to do itSell it yourself
Take full control of how buyers see your home on Zillow by listing For Sale by Owner (FSBO).
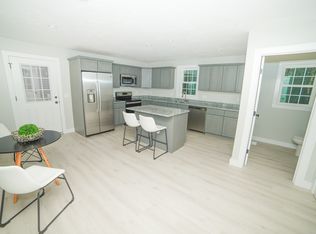
List your homeThree FOrm A lots, 60,000 SF totaling 4.59 Acres. 525' Frontage.
This property is off market, which means it's not currently listed for sale or rent on Zillow. This may be different from what's available on other websites or public sources.
| Date | Event | Price |
|---|---|---|
| 11/26/2016 | Listing removed | $500,000$220/sqft |
Source: Rogue Real Estate #72053546 Report a problem | ||
| 8/15/2016 | Listed for sale | $500,000-32.4%$220/sqft |
Source: Rogue Real Estate #72053546 Report a problem | ||
| 11/6/2013 | Listing removed | $739,900$325/sqft |
Source: Chattel Realty #71472542 Report a problem | ||
| 9/5/2013 | Listed for sale | $739,900$325/sqft |
Source: Chattel Realty #71472542 Report a problem | ||
| 4/17/2013 | Listing removed | $739,900$325/sqft |
Source: Chattel Realty #21300441 Report a problem | ||
| 1/29/2013 | Listed for sale | $739,900-6.3%$325/sqft |
Source: Chattel Realty #21300441 Report a problem | ||
| 9/2/2012 | Listing removed | $789,900$347/sqft |
Source: Century 21 Tassinari & Assoc. #71333779 Report a problem | ||
| 2/4/2012 | Listed for sale | $789,900+85.9%$347/sqft |
Source: Century 21 Tassinari & Assoc. #71333779 Report a problem | ||
| 3/31/2011 | Listing removed | $425,000$187/sqft |
Source: New England Group Services Report a problem | ||
| 12/24/2010 | Listed for sale | $425,000$187/sqft |
Source: New England Group Services Report a problem | ||
| 9/26/2010 | Listing removed | $425,000$187/sqft |
Source: Kenny Olson #71019530 Report a problem | ||
| 8/19/2010 | Price change | $425,000-52.7%$187/sqft |
Source: Kenny Olson #71019530 Report a problem | ||
| 3/4/2010 | Listed for sale | $899,000+799%$395/sqft |
Source: Francis Gropman #71039517 Report a problem | ||
| 2/12/2010 | Sold | $100,000-76.5%$44/sqft |
Source: Public Record Report a problem | ||
| 1/16/2010 | Listed for sale | $425,000-55%$187/sqft |
Source: Francis Gropman #71039517 Report a problem | ||
| 10/5/2009 | Listing removed | $945,000$416/sqft |
Source: Options 1-5-3 Real Estate, Mullen & Partners #70889829 Report a problem | ||
| 7/23/2009 | Price change | $945,000-5.4%$416/sqft |
Source: Peter Ruffini #70889829 Report a problem | ||
| 3/7/2009 | Price change | $999,000-24.3%$439/sqft |
Source: Peter Ruffini #70889829 Report a problem | ||
| 3/4/2009 | Price change | $1,319,000+32%$580/sqft |
Source: Peter Ruffini #70889829 Report a problem | ||
| 2/28/2009 | Price change | $999,000-24.3%$439/sqft |
Source: NCI #70822231 Report a problem | ||
| 2/26/2009 | Price change | $1,319,000+32%$580/sqft |
Source: NCI #70822231 Report a problem | ||
| 2/23/2009 | Listed for sale | $999,000+53.7%$439/sqft |
Source: NCI #70822231 Report a problem | ||
| 5/31/2006 | Sold | $650,000+13%$286/sqft |
Source: Public Record Report a problem | ||
| 10/3/2005 | Sold | $575,000$253/sqft |
Source: Public Record Report a problem | ||
| Year | Property taxes | Tax assessment |
|---|---|---|
| 2025 | $70,168 | $5,182,300 |
| 2024 | $70,168 +2933.6% | $5,182,300 +3091.1% |
| 2023 | $2,313 +6.5% | $162,400 +15% |
| 2022 | $2,172 +7.9% | $141,200 +14.1% |
| 2021 | $2,013 +2.5% | $123,700 |
| 2020 | $1,964 +2.6% | $123,700 |
| 2019 | $1,915 -48.6% | $123,700 -48.2% |
| 2018 | $3,724 +2% | $238,700 +3.1% |
| 2017 | $3,651 +4.9% | $231,500 +5.9% |
| 2016 | $3,479 +3.6% | $218,500 +2.7% |
| 2015 | $3,358 -4.1% | $212,800 -5.2% |
| 2014 | $3,502 +15.4% | $224,500 +10.2% |
| 2013 | $3,035 -2% | $203,800 -9.6% |
| 2012 | $3,098 -0.6% | $225,500 -5.6% |
| 2011 | $3,118 -6.1% | $238,900 -14.9% |
| 2010 | $3,321 +8.6% | $280,700 +0.3% |
| 2009 | $3,058 -13.1% | $279,800 -15% |
| 2008 | $3,521 +14.6% | $329,100 -0.6% |
| 2007 | $3,072 -18.5% | $331,000 -13.6% |
| 2006 | $3,768 +15.2% | $383,300 +27.1% |
| 2005 | $3,272 +9.1% | $301,600 +17.4% |
| 2004 | $2,998 +10.5% | $256,900 +44.8% |
| 2003 | $2,712 +3.6% | $177,400 |
| 2002 | $2,618 +12.5% | $177,400 +29.7% |
| 2000 | $2,328 | $136,800 |
Find assessor info on the county website