$229,500
1 bd|2 ba|857 sqft
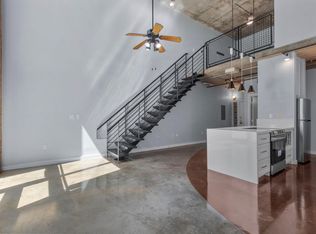
2000 Bagby St APT 5403, Houston, TX 77002
For Sale
Zillow last checked:
Listing updated:
Evelyn Griffin TREC #0726661 832-741-7077,
MORE Realty Group
$379,300
$360,000 - $398,000
$2,630/mo
| Date | Event | Price |
|---|---|---|
| 4/15/2026 | Price change | $395,000+6.8%$210/sqft |
Source: | ||
| 3/4/2026 | Price change | $370,000-6.3%$196/sqft |
Source: | ||
| 5/2/2025 | Pending sale | $395,000$210/sqft |
Source: | ||
| 2/26/2025 | Price change | $395,000-6%$210/sqft |
Source: | ||
| 10/29/2024 | Listed for sale | $420,000-6.7%$223/sqft |
Source: | ||
| 7/24/2024 | Listing removed | -- |
Source: | ||
| 5/8/2024 | Listed for sale | $450,000-3.2%$239/sqft |
Source: | ||
| 5/8/2024 | Listing removed | -- |
Source: | ||
| 3/1/2024 | Price change | $465,000-2.1%$247/sqft |
Source: | ||
| 1/30/2024 | Listed for sale | $475,000+14.5%$252/sqft |
Source: | ||
| 2/24/2020 | Sold | -- |
Source: Agent Provided Report a problem | ||
| 2/7/2020 | Pending sale | $415,000$220/sqft |
Source: Better Homes and Gardens Real Estate Gary Greene #50850760 Report a problem | ||
| 11/26/2019 | Listed for sale | $415,000+1.2%$220/sqft |
Source: BHGRE Gary Greene #50850760 Report a problem | ||
| 6/30/2015 | Sold | -- |
Source: Agent Provided Report a problem | ||
| 5/18/2015 | Pending sale | $410,000$218/sqft |
Source: John Daugherty, REALTORS #10316105 Report a problem | ||
| 4/20/2015 | Price change | $410,000-3.5%$218/sqft |
Source: John Daugherty, REALTORS #10316105 Report a problem | ||
| 1/15/2015 | Price change | $425,000-5.6%$226/sqft |
Source: John Daugherty, REALTORS #10316105 Report a problem | ||
| 11/25/2014 | Price change | $450,000-1.6%$239/sqft |
Source: John Daugherty, REALTORS #10316105 Report a problem | ||
| 11/11/2014 | Price change | $457,500-1.6%$243/sqft |
Source: John Daugherty, REALTORS #10316105 Report a problem | ||
| 8/30/2014 | Listed for sale | $465,000$247/sqft |
Source: The Reyna Realty Group #10316105 Report a problem | ||
| Year | Property taxes | Tax assessment |
|---|---|---|
| 2025 | $9,628 +2.7% | $453,043 +1.1% |
| 2024 | $9,379 +7.7% | $448,253 +3.7% |
| 2023 | $8,712 -4.9% | $432,378 +4% |
| 2022 | $9,158 | $415,936 +3.6% |
| 2021 | -- | $401,294 |
| 2020 | $7,440 -4.2% | $401,294 -3.2% |
| 2019 | $7,770 -15.3% | $414,657 -7% |
| 2018 | $9,177 | $445,918 |
| 2017 | $9,177 +7.9% | $445,918 +7.7% |
| 2016 | $8,507 +18.9% | $414,078 |
| 2015 | $7,153 | $414,078 +2.9% |
| 2014 | $7,153 | $402,533 +30.5% |
| 2013 | -- | $308,351 +6.1% |
| 2012 | -- | $290,726 +7.8% |
| 2011 | -- | $269,751 |
| 2010 | -- | $269,751 -15.2% |
| 2009 | -- | $317,932 -10.7% |
| 2008 | -- | $356,054 |
| 2007 | -- | -- |
Find assessor info on the county website
Source: HAR. This data may not be complete. We recommend contacting the local school district to confirm school assignments for this home.
A local agent can set up tours, give advice and negotiate with sellers.