$277,500
4 bd2 ba1.8k sqft
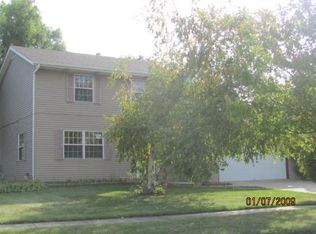
206 N Bridge Rd, Dekalb, IL 60115
Off Market
$320,000
$294,000 - $349,000
$2,798/mo
$2,798/mo
Rent Zestimate®
Find your next renter with Zillow Rental Manager. Plus, with online applications, you can quickly screen prospective tenants – for free.
$2,798/mo
Rent Zestimate®
$2,378/mo
Est. payment
Refinancing to a lower rate could help reduce your monthly payments and save thousands over the life of the loan.
$2,378/mo
Est. payment
Work with a Zillow partner agent
Leverage their expertise and Zillow's premium Showcase listings to get your home seen by more buyers.
Get startedList with your own agent
Get your home in front of millions of buyers by listing it on Zillow.
Learn how to do itSell it yourself
Take full control of how buyers see your home on Zillow by listing For Sale by Owner (FSBO).
List your homeZillow last checked:
Listing updated:
Dana Smith 630-561-6371,
Coldwell Banker Real Estate Group
Camyle Tate
Weichert REALTORS Signature Professionals
| Date | Event | Price |
|---|---|---|
| 7/13/2026 | Sold | $320,000-3%$143/sqft |
Source: | ||
| 6/15/2026 | Contingent | $330,000$147/sqft |
Source: | ||
| 6/3/2026 | Listed for sale | $330,000+27%$147/sqft |
Source: | ||
| 2/21/2023 | Listing removed | -- |
Source: | ||
| 2/5/2023 | Pending sale | $259,900+4%$116/sqft |
Source: | ||
| 2/3/2023 | Sold | $250,000-3.8%$112/sqft |
Source: | ||
| 1/9/2023 | Pending sale | $259,900$116/sqft |
Source: | ||
| 1/9/2023 | Contingent | $259,900$116/sqft |
Source: | ||
| 11/13/2022 | Price change | $259,900-1.9%$116/sqft |
Source: | ||
| 10/6/2022 | Price change | $264,900-1.9%$118/sqft |
Source: | ||
| 8/27/2022 | Listed for sale | $269,900+169.9%$120/sqft |
Source: | ||
| 3/19/2018 | Listing removed | $1,800$1/sqft |
Source: RE/MAX Experience #09817233 Report a problem | ||
| 12/14/2017 | Listed for rent | $1,800$1/sqft |
Source: RE/MAX Experience #09817233 Report a problem | ||
| 5/17/2017 | Sold | $100,000-5.6%$45/sqft |
Source: Public Record Report a problem | ||
| 4/22/2017 | Pending sale | $105,900$47/sqft |
Source: RE/MAX Experience #09480461 Report a problem | ||
| 4/5/2017 | Price change | $105,900-3.6%$47/sqft |
Source: RE/MAX Experience #09480461 Report a problem | ||
| 3/22/2017 | Price change | $109,900-6.8%$49/sqft |
Source: RE/MAX Experience #09480461 Report a problem | ||
| 2/21/2017 | Price change | $117,900-1.7%$53/sqft |
Source: RE/MAX Experience #09480461 Report a problem | ||
| 1/19/2017 | Listed for sale | $119,900$54/sqft |
Source: RE/MAX Experience #09480461 Report a problem | ||
| Year | Property taxes | Tax assessment |
|---|---|---|
| 2024 | $6,195 -2.9% | $77,755 +14.7% |
| 2023 | $6,382 +2% | $67,795 +9.5% |
| 2022 | $6,255 -2.6% | $61,896 +6.6% |
| 2021 | $6,424 -2.2% | $58,053 +1.6% |
| 2020 | $6,569 +2% | $57,127 +4.1% |
| 2019 | $6,440 +2.4% | $54,883 +3.5% |
| 2018 | $6,289 -0.9% | $53,022 +4% |
| 2017 | $6,348 -8.2% | $50,968 -16.1% |
| 2016 | $6,916 | $60,726 +5.5% |
| 2015 | -- | $57,539 -3.5% |
| 2014 | -- | $59,610 -4.8% |
| 2013 | -- | $62,616 -8.9% |
| 2012 | -- | $68,755 -9% |
| 2011 | -- | $75,530 -5.7% |
| 2010 | -- | $80,082 -6.1% |
| 2009 | -- | $85,266 +1.5% |
| 2008 | -- | $84,006 +3.1% |
| 2007 | -- | $81,464 +14.8% |
| 2006 | -- | $70,972 |
Source: MRED as distributed by MLS GRID. This data may not be complete. We recommend contacting the local school district to confirm school assignments for this home.
An equal housing lender. NMLS #10287.
