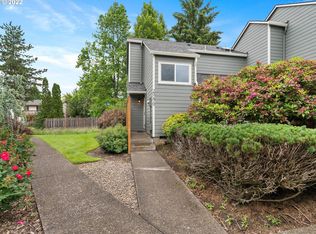
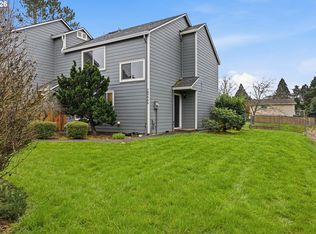
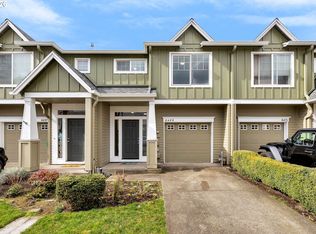
Blocks from South Hillsboro Project, 3 bedroom Condo central to shopping, bus, and more. Spacious rooms with
large new windows allows natural light to shine through. Condo backing to green space with lots of grass and trees for a tranquil setting. Enjoy your own fenced patio off the formal dining room or deck off the master suite both backing to green space. HOA includes water, sewer and garbage. Pool open during kids summer vacation life guard is on duty. All new siding, roofs, windows, decks and paint. Process of all new fencing. All updates are paid for by prior assessment.
Pre-foreclosure
Est. $300,000
20474 SW Rosa Dr, Aloha, OR 97078
3beds
1,278sqft
Condo
Built in 1986
-- sqft lot
$300,000 Zestimate®
$235/sqft
$-- HOA
Overview
- 69 days |
- 29 |
- 1 |
Facts & features
Interior
Bedrooms & bathrooms
- Bedrooms: 3
- Bathrooms: 2
- Full bathrooms: 1
- 1/2 bathrooms: 1
Heating
- Forced air, Electric
Cooling
- None
Appliances
- Included: Dishwasher, Dryer, Garbage disposal, Range / Oven, Refrigerator, Washer
- Laundry: In Unit
Features
- Flooring: Carpet, Linoleum / Vinyl
- Basement: None
- Has fireplace: Yes
Interior area
- Total interior livable area: 1,278 sqft
Property
Parking
- Total spaces: 1
- Parking features: Garage - Detached
Features
- Exterior features: Other, Wood
Details
- Parcel number: 1S214DD91022
Construction
Type & style
- Home type: Condo
Materials
- wood frame
- Roof: Composition
Condition
- Year built: 1986
Community & HOA
Location
- Region: Aloha
Financial & listing details
- Price per square foot: $235/sqft
- Tax assessed value: $308,560
- Annual tax amount: $2,629
Visit our professional directory to find a foreclosure specialist in your area that can help with your home search.
Find a foreclosure agentForeclosure details
Estimated market value
$300,000
$282,000 - $315,000
$2,093/mo
Price history
Price history
| Date | Event | Price |
|---|---|---|
| 7/19/2022 | Sold | $350,000+37.5%$274/sqft |
Source: Public Record Report a problem | ||
| 3/24/2021 | Listing removed | -- |
Source: Owner Report a problem | ||
| 8/29/2019 | Listing removed | $1,650$1/sqft |
Source: Owner Report a problem | ||
| 8/11/2019 | Listed for rent | $1,650+4.8%$1/sqft |
Source: Owner Report a problem | ||
| 8/11/2019 | Listing removed | $254,500$199/sqft |
Source: Owner Report a problem | ||
| 7/27/2019 | Price change | $254,500-1.9%$199/sqft |
Source: Owner Report a problem | ||
| 7/11/2019 | Listed for sale | $259,500+82.7%$203/sqft |
Source: Owner Report a problem | ||
| 7/4/2019 | Listing removed | $1,575$1/sqft |
Source: Owner Report a problem | ||
| 6/11/2019 | Listed for rent | $1,575$1/sqft |
Source: Owner Report a problem | ||
| 8/2/2018 | Listing removed | $1,575$1/sqft |
Source: Owner Report a problem | ||
| 7/25/2018 | Listed for rent | $1,575$1/sqft |
Source: Owner Report a problem | ||
| 2/26/2014 | Sold | $142,000-2%$111/sqft |
Source: | ||
| 12/24/2013 | Pending sale | $144,900$113/sqft |
Source: RE/MAX EQUITY GROUP-HILLSBORO OFFICE #13071138 Report a problem | ||
| 12/3/2013 | Price change | $144,900-2.8%$113/sqft |
Source: RE/MAX EQUITY GROUP-HILLSBORO OFFICE #13071138 Report a problem | ||
| 11/5/2013 | Listed for sale | $149,000-9.6%$117/sqft |
Source: RE/MAX EQUITY GROUP-HILLSBORO OFFICE #13071138 Report a problem | ||
| 6/27/2006 | Sold | $164,900$129/sqft |
Source: Public Record Report a problem | ||
Public tax history
Public tax history
| Year | Property taxes | Tax assessment |
|---|---|---|
| 2025 | $2,629 +1.6% | $171,640 +3% |
| 2024 | $2,587 +2.9% | $166,650 +3% |
| 2023 | $2,514 +4.1% | $161,800 +3% |
| 2022 | $2,414 +1.9% | $157,090 |
| 2021 | $2,368 +2.2% | -- |
| 2020 | $2,318 +3.7% | $148,080 +3% |
| 2019 | $2,235 +4.5% | $143,770 |
| 2018 | $2,138 | $143,770 +6.1% |
| 2017 | $2,138 +6.7% | $135,530 +3% |
| 2016 | $2,005 | $131,590 +3% |
| 2015 | $2,005 +3.9% | $127,760 +3% |
| 2014 | $1,929 +6% | $124,040 +3% |
| 2013 | $1,820 +5.4% | $120,430 +4.5% |
| 2012 | $1,726 -3.2% | $115,200 -7.7% |
| 2011 | $1,783 +0.9% | $124,870 -14.1% |
| 2010 | $1,766 +0.8% | $145,410 -5.4% |
| 2009 | $1,753 +6.8% | $153,750 -14% |
| 2008 | $1,642 -2.5% | $178,840 -0.4% |
| 2007 | $1,685 +19.8% | $179,540 +26.6% |
| 2006 | $1,406 -0.6% | $141,830 +13.7% |
| 2005 | $1,415 +0.7% | $124,690 +6.3% |
| 2004 | $1,405 +2.6% | $117,270 +0.9% |
| 2003 | $1,370 +3% | $116,220 +0.2% |
| 2002 | $1,330 -0.4% | $115,990 +1.7% |
| 2001 | $1,335 +19.1% | $114,080 +1.7% |
| 2000 | $1,121 | $112,120 |
Find assessor info on the county website
Monthly payment
Estimated monthly payment
All calculations are estimates and provided by Zillow, Inc. for informational purposes only. Actual amounts may vary.
HOA fees may include property taxes on listings classified as Co-Ops. Contact the listing agent and/or owner for fee details.
Mortgage interest rates are dependent on a number of factors, including credit score, down payment, and repayment length. Interest rate data provided by Zillow Group Marketplace, Inc. as of 1/1/1970 from various mortgage lenders with which we have lead or other similar arrangements; the Estimated Payment is an average of those rates.
See how much you could borrow to make a competitive offer.
Climate risks
Neighborhood: Aloha
Nearby schools
GreatSchools rating
- 6/10Butternut Creek Elementary SchoolGrades: K-6Distance: 0.6 mi
- 4/10R A Brown Middle SchoolGrades: 7-8Distance: 2.2 mi
- 8/10Century High SchoolGrades: 9-12Distance: 2.1 mi

- Oregon
- Washington County
- Beaverton
- 97078
- Aloha
- 20474 SW Rosa Dr
Nearby cities
Nearby neighborhoods
Nearby zip codes
Other Beaverton Topics
