$294,400
4 bd|2 ba|1.8k sqft
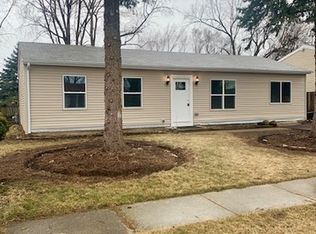
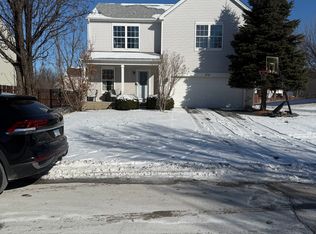
203 Fremont Ave, Romeoville, IL 60446
Off Market
Zillow last checked: 7 hours ago
Listing updated: 18 hours ago
Marisa Silva 847-907-1938,
Realty of America, LLC
Not available
Estimated sales range
Not available
Not available
| Date | Event | Price |
|---|---|---|
| 3/26/2026 | Listed for sale | $325,000+18.2%$181/sqft |
Source: | ||
| 10/26/2023 | Listing removed | -- |
Source: | ||
| 10/6/2023 | Listed for sale | $275,000+83.3%$153/sqft |
Source: | ||
| 11/7/2012 | Sold | $150,000-6.2%$83/sqft |
Source: | ||
| 9/4/2012 | Listed for sale | $159,900+210.5%$89/sqft |
Source: Online Realty Professionals.com #08149866 Report a problem | ||
| 10/31/2011 | Sold | $51,500-9.5%$29/sqft |
Source: | ||
| 8/10/2011 | Price change | $56,900-9.9%$32/sqft |
Source: Regional Realty Group #07686483 Report a problem | ||
| 6/23/2011 | Price change | $63,175-5%$35/sqft |
Source: Regional Realty Group #07686483 Report a problem | ||
| 5/21/2011 | Price change | $66,500-5%$37/sqft |
Source: Regional Realty Group #07686483 Report a problem | ||
| 4/16/2011 | Listed for sale | $70,000$39/sqft |
Source: Regional Realty Group #07686483 Report a problem | ||
| 1/10/2011 | Listing removed | $70,000$39/sqft |
Source: Regional Realty Group #07686483 Report a problem | ||
| 12/4/2010 | Price change | $70,000+40.3%$39/sqft |
Source: Regional Realty Group #07686483 Report a problem | ||
| 11/26/2010 | Listed for sale | $49,900$28/sqft |
Source: Coldwell Banker Honig-Bell #07456997 Report a problem | ||
| 10/21/2010 | Listing removed | $49,900$28/sqft |
Source: Coldwell Banker Honig-Bell #07456997 Report a problem | ||
| 9/25/2010 | Listed for sale | $49,900-47.4%$28/sqft |
Source: Coldwell Banker Honig-Bell #07456997 Report a problem | ||
| 6/20/2010 | Listing removed | $94,900$53/sqft |
Source: Coldwell Banker Honig-Bell #07456997 Report a problem | ||
| 3/3/2010 | Listed for sale | $94,900-36.1%$53/sqft |
Source: Honig Realty, Inc. (dba. Coldwell Banker Honig-Bell) #07456997 Report a problem | ||
| 12/9/2009 | Sold | $148,626+18%$83/sqft |
Source: Public Record Report a problem | ||
| 12/27/2007 | Sold | $126,000+39.2%$70/sqft |
Source: Public Record Report a problem | ||
| 7/7/1995 | Sold | $90,500$50/sqft |
Source: Public Record Report a problem | ||
| Year | Property taxes | Tax assessment |
|---|---|---|
| 2023 | $6,895 +9.5% | $78,494 +13.5% |
| 2022 | $6,299 +4.9% | $69,154 +6.4% |
| 2021 | $6,003 +2.9% | $64,988 +3.4% |
| 2020 | $5,832 +4.6% | $62,851 +5.5% |
| 2019 | $5,575 +8.3% | $59,574 +8.9% |
| 2018 | $5,148 +6.6% | $54,717 +5.9% |
| 2017 | $4,831 +6.1% | $51,654 +6.7% |
| 2016 | $4,552 +18.4% | $48,411 +12.5% |
| 2015 | $3,844 | $43,048 +7% |
| 2014 | $3,844 +1.3% | $40,232 -2% |
| 2013 | $3,793 -15.9% | $41,053 -9% |
| 2012 | $4,508 -2.1% | $45,113 -13% |
| 2011 | $4,604 +11.2% | $51,854 -10.7% |
| 2010 | $4,140 -4.5% | $58,035 -9% |
| 2009 | $4,336 +5% | $63,775 |
| 2008 | $4,128 | $63,775 +3.6% |
| 2007 | -- | $61,588 +10% |
| 2006 | $3,752 +2.4% | $55,989 +5.6% |
| 2005 | $3,665 +22.5% | $53,014 +20% |
| 2004 | $2,991 +3.2% | $44,179 +5.1% |
| 2003 | $2,899 +3.5% | $42,039 +7% |
| 2002 | $2,800 -2.6% | $39,278 +2% |
| 2001 | $2,874 +12.4% | $38,500 +7.1% |
| 2000 | $2,557 | $35,948 |
Find assessor info on the county website
Source: MRED as distributed by MLS GRID. This data may not be complete. We recommend contacting the local school district to confirm school assignments for this home.