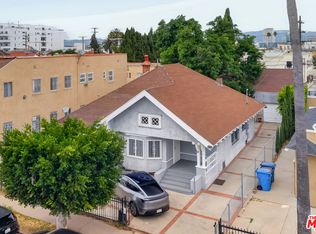
Proudly presenting 1028 S Kenmore – a 4-unit income property located in a highly desirable Los Angeles rental market. This property offers an excellent opportunity for investors seeking steady cash flow and long-term appreciation. Ideally situated near Koreatown, major transportation corridors, and a variety of local amenities, making it attractive to tenants. A great addition to any investment portfolio.
For sale
Listed by: EXCELLENCE RE REAL ESTATE • RICARDO GARZA • Contact: 213-216-0334
$1,400,000
1028 S Kenmore Ave, Los Angeles, CA 90006
5beds
4baths
2,408sqft
Quadruplex
Built in 1954
-- sqft lot
$1,290,300 Zestimate®
$581/sqft
$-- HOA
What's special
- 215 days
- 19
- 0
Zillow last checked:
Listing updated:
Listed by:
RICARDO GARZA DRE #01369551 213-216-0334,
EXCELLENCE RE REAL ESTATE
Source: CRMLS,MLS#: MB26061761 Originating MLS: California Regional MLS
Facts & features
Interior
Bedrooms & bathrooms
- Bedrooms: 5
- Bathrooms: 4
Heating
- None
Cooling
- None
Appliances
- Laundry: None
Features
- Flooring: Vinyl, Wood
- Has fireplace: No
- Fireplace features: None
- Common walls with other units/homes: 1 Common Wall
Interior area
- Total structure area: 2,408
- Total interior livable area: 2,408 sqft
Property
Parking
- Total spaces: 1
- Parking features: Driveway
- Garage spaces: 1
Features
- Entry location: 1
- Pool features: None
- Spa features: None
- Fencing: Wrought Iron
Lot
- Size: 5,908 Square Feet
- Features: Front Yard
Details
- Parcel number: 5078014020
- Special conditions: Standard
Construction
Type & style
- Home type: MultiFamily
- Property subtype: Quadruplex
- Attached to another structure: Yes
Materials
- Roof: Composition,Shingle
Condition
- New construction: No
- Year built: 1954
Utilities & green energy
- Sewer: Public Sewer
- Water: Public
Community & HOA
Community
- Features: Street Lights, Sidewalks
- Security: Carbon Monoxide Detector(s), Smoke Detector(s)
Location
- Region: Los Angeles
Financial & listing details
- Price per square foot: $581/sqft
- Tax assessed value: $1,052,252
- Date on market: 3/21/2026
- Cumulative days on market: 216 days
- Listing terms: Cash,Cash to New Loan,Conventional,FHA
- Tenant pays: Electricity, Gas
Estimated market value
$1,290,300
$1.23M - $1.35M
$2,478/mo
Price history
| Date | Event | Price |
|---|---|---|
| 3/21/2026 | Listed for sale | $1,400,000+81.8%$581/sqft |
Source:  CRMLS #MB26061761 Report a problem | ||
| 12/22/2006 | Sold | $770,000+327.8%$320/sqft |
Source: Public Record Report a problem | ||
| 5/19/1998 | Sold | $180,000$75/sqft |
Source: Public Record Report a problem | ||
Public tax history
| Year | Property taxes | Tax assessment |
|---|---|---|
| 2026 | -- | $1,052,252 +2% |
| 2025 | $12,740 +1.1% | $1,031,620 +2% |
| 2024 | $12,598 +1.9% | $1,011,393 +2% |
| 2023 | $12,361 +4.8% | $991,562 +2% |
| 2022 | $11,796 +1.3% | $972,120 +2% |
| 2021 | $11,645 -1% | $953,060 +1% |
| 2020 | $11,762 | $943,289 +2% |
| 2019 | $11,762 +5.1% | $924,794 +2% |
| 2018 | $11,193 | $906,662 +2% |
| 2017 | $11,193 +2.2% | $888,886 +2% |
| 2016 | $10,954 +2.4% | $871,458 +1.5% |
| 2015 | $10,699 +48% | $858,369 +51.9% |
| 2014 | $7,231 | $565,000 +41.3% |
| 2012 | -- | $400,000 |
| 2011 | -- | $400,000 -32% |
| 2010 | -- | $588,000 -26.6% |
| 2009 | -- | $801,108 +2% |
| 2008 | -- | $785,400 +2% |
| 2007 | -- | $770,000 +199.6% |
| 2006 | -- | $257,050 |
| 2005 | -- | $257,050 +4% |
| 2004 | -- | $247,071 +1.9% |
| 2003 | -- | $242,544 +2% |
| 2002 | -- | $237,789 +4% |
| 2000 | -- | $228,556 |
Find assessor info on the county website
Monthly payment
Est. payment
Payment breakdown
Explore the cost of this home by adjusting the details. Changes won't be saved.Climate risks
Neighborhood: Koreatown
- $837,4003 bd1 ba889 sqft1034 S Kenmore Ave, Los Angeles, CA 90006Off Market
- $2,923,0002 bd1 ba821 sqft1024 S Kenmore Ave, Los Angeles, CA 90006Off Market
- $863,1003 bd1 ba1k sqft1038 S Kenmore Ave, Los Angeles, CA 90006Off Market
- $5,849,0009 bd3 ba2.4k sqft1020 S Kenmore Ave, Los Angeles, CA 90006Off Market
Similar homes
- $1,190,0002 bd2 ba1.9k sqft3030 W 12th Pl, Los Angeles, CA 90006For Sale
 MLS ID #26843211, Arthur Yoon DRE # 01955545, Redpoint Realty. CLAW
- $1,050,0004 bd3 ba2.1k sqft1757 S New England St, Los Angeles, CA 90006For Sale
 MLS ID #DW26125775, Julio Midolo, ReMax Sky. CRMLS
- $870,0004 bd4 ba1.4k sqft2905 W 14th St, Los Angeles, CA 90006For Sale
 MLS ID #26866467, Sharon Oh DRE # 01712047, Redpoint Realty. CLAW
- $1,679,0006 bd4 ba2.8k sqft225 S Hoover St, Los Angeles, CA 90004For Sale
 MLS ID #26858467, Laura Markosian DRE # 01291002, Coldwell Banker Realty. CLAW
