$318,700
6 bd|2 ba|2.7k sqft
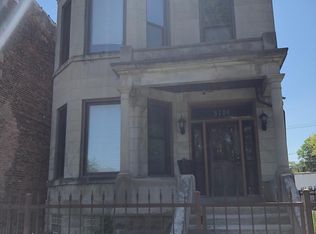
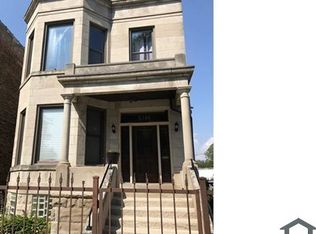
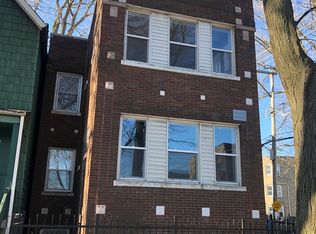
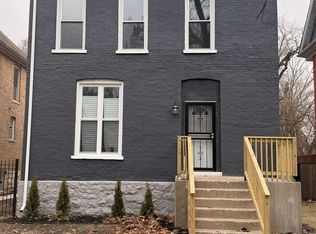
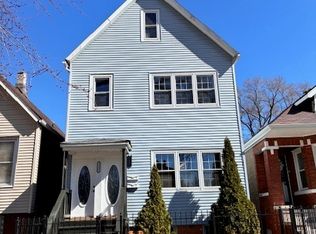
5704 S Peoria St FLOOR 1, Chicago, IL 60621
Off Market
Zillow last checked: 7 hours ago
Listing updated: March 12, 2026 at 10:13am
Jayme Dominicak 708-548-5670,
Jayme Dominicak
Not available
Estimated sales range
Not available
Not available
| Date | Event | Price |
|---|---|---|
| 10/3/2025 | Price change | $299,900-7.7% |
Source: | ||
| 3/4/2025 | Price change | $324,900-1.5% |
Source: | ||
| 1/15/2025 | Price change | $329,900-1.5% |
Source: | ||
| 10/29/2024 | Price change | $334,900-1.5% |
Source: | ||
| 9/4/2024 | Listed for sale | $340,000-6.8% |
Source: | ||
| 5/28/2024 | Listing removed | -- |
Source: | ||
| 5/3/2024 | Listed for sale | $364,900 |
Source: | ||
| 4/25/2024 | Contingent | $364,900 |
Source: | ||
| 4/5/2024 | Listed for sale | $364,900+1.4% |
Source: | ||
| 12/20/2023 | Listing removed | -- |
Source: | ||
| 11/1/2023 | Price change | $360,000-2.7% |
Source: | ||
| 10/28/2023 | Listed for sale | $370,000+164.3% |
Source: | ||
| 3/8/2022 | Sold | $140,000-15.2% |
Source: | ||
| 1/19/2022 | Contingent | $165,000 |
Source: | ||
| 12/22/2021 | Listed for sale | $165,000 |
Source: | ||
| 12/21/2021 | Contingent | $165,000 |
Source: | ||
| 12/8/2021 | Listed for sale | $165,000-16.7% |
Source: | ||
| 10/22/2021 | Listing removed | -- |
Source: | ||
| 7/19/2021 | Price change | $198,000-13.9% |
Source: | ||
| 6/29/2021 | Listed for sale | $229,900 |
Source: | ||
| 6/23/2021 | Contingent | $229,900 |
Source: | ||
| 6/15/2021 | Listed for sale | $229,900 |
Source: | ||
| Year | Property taxes | Tax assessment |
|---|---|---|
| 2023 | $1,899 +2.6% | $8,999 |
| 2022 | $1,851 +2.3% | $8,999 |
| 2021 | $1,810 +0.3% | $8,999 +11.1% |
| 2020 | $1,805 -3.5% | $8,103 -13% |
| 2019 | $1,871 +1.7% | $9,314 |
| 2018 | $1,840 -49.8% | $9,314 -45.3% |
| 2017 | $3,665 +7.5% | $17,026 |
| 2016 | $3,410 +9.3% | $17,026 |
| 2015 | $3,120 +7.8% | $17,026 +9.1% |
| 2014 | $2,895 +2% | $15,601 |
| 2013 | $2,837 +1.4% | $15,601 |
| 2012 | $2,800 -4.3% | $15,601 -13.6% |
| 2011 | $2,927 -0.4% | $18,060 |
| 2010 | $2,939 +4.4% | $18,060 |
| 2009 | $2,816 -0.1% | $18,060 -8.1% |
| 2008 | $2,818 +1% | $19,645 |
| 2007 | $2,790 -11.6% | $19,645 -10.7% |
| 2006 | $3,157 +146.3% | $21,988 +180.3% |
| 2005 | $1,282 +1% | $7,844 |
| 2004 | $1,269 +2.2% | $7,844 |
| 2003 | $1,241 -0.8% | $7,844 +12.7% |
| 2002 | $1,251 +3.7% | $6,961 |
| 2001 | $1,205 +34% | $6,961 |
| 2000 | $900 -0.7% | $6,961 +48.6% |
| 1999 | $906 | $4,683 |
Find assessor info on the county website
Source: MRED as distributed by MLS GRID. This data may not be complete. We recommend contacting the local school district to confirm school assignments for this home.