$--
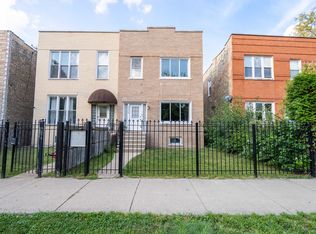
3 bd|1 ba|1.1k sqft
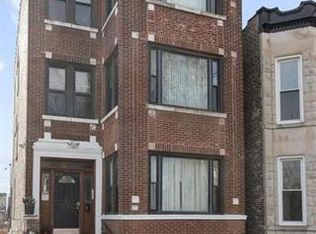
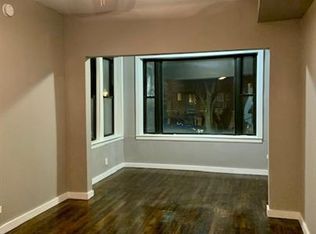
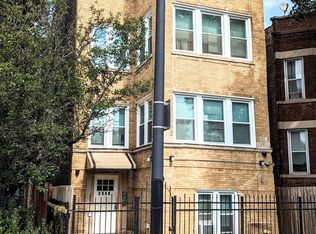
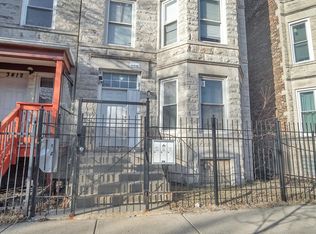
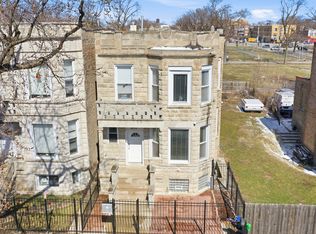
3235 W Flournoy St #3, Chicago, IL 60624
Off Market
Zillow last checked: 7 hours ago
Listing updated: March 07, 2026 at 12:02am
Maurice Goodman 815-325-1245,
CMG Realty & Property Management LLC
Not available
Estimated sales range
Not available
Not available
| Date | Event | Price |
|---|---|---|
| 3/6/2026 | Contingent | $635,000 |
Source: | ||
| 2/15/2026 | Listed for sale | $635,000 |
Source: | ||
| 1/27/2026 | Contingent | $635,000 |
Source: | ||
| 12/4/2025 | Price change | $635,000-4.5% |
Source: | ||
| 11/6/2025 | Price change | $665,000-2.9% |
Source: | ||
| 10/16/2025 | Listed for sale | $685,000+136.2% |
Source: | ||
| 3/10/2020 | Sold | $290,000+5.5% |
Source: | ||
| 2/6/2020 | Pending sale | $275,000 |
Source: Coldwell Banker Residential Brokerage - Hyde Park #10593010 Report a problem | ||
| 2/1/2020 | Listed for sale | $275,000 |
Source: Coldwell Banker Residential Brokerage - Hyde Park #10593010 Report a problem | ||
| 12/23/2019 | Pending sale | $275,000 |
Source: Coldwell Banker Residential Brokerage - Hyde Park #10593010 Report a problem | ||
| 12/16/2019 | Listed for sale | $275,000 |
Source: Coldwell Banker Residential #10593010 Report a problem | ||
| Year | Property taxes | Tax assessment |
|---|---|---|
| 2023 | $3,599 -32.9% | $16,997 -34.6% |
| 2022 | $5,366 +2.3% | $25,999 |
| 2021 | $5,245 +34.5% | $25,999 +49% |
| 2020 | $3,900 -2.4% | $17,447 -12% |
| 2019 | $3,997 +1.7% | $19,827 |
| 2018 | $3,929 -20.6% | $19,827 -13.4% |
| 2017 | $4,948 +7.9% | $22,906 |
| 2016 | $4,588 +9.3% | $22,906 |
| 2015 | $4,197 +8.7% | $22,906 +10.1% |
| 2014 | $3,861 +2% | $20,810 |
| 2013 | $3,785 +1.4% | $20,810 |
| 2012 | $3,734 -10.5% | $20,810 -19.2% |
| 2011 | $4,173 -0.4% | $25,753 |
| 2010 | $4,191 +4.4% | $25,753 |
| 2009 | $4,016 +19% | $25,753 +9.4% |
| 2008 | $3,376 +1% | $23,533 |
| 2007 | $3,342 -23.1% | $23,533 -22.3% |
| 2006 | $4,345 +65.4% | $30,270 +88.2% |
| 2005 | $2,628 +1% | $16,082 |
| 2004 | $2,601 -5.8% | $16,082 -7.8% |
| 2003 | $2,761 +48.3% | $17,446 +68.4% |
| 2002 | $1,861 +28.9% | $10,361 |
| 2001 | $1,444 +31.3% | $10,361 |
| 2000 | $1,100 -2.3% | $10,361 +41.1% |
| 1999 | $1,126 | $7,343 |
Find assessor info on the county website
Source: MRED as distributed by MLS GRID. This data may not be complete. We recommend contacting the local school district to confirm school assignments for this home.